From protozoans to people, there is a lot of life on this planet, and it’s all connected to a common ancestor from which everything descends. It’s hard to imagine, let alone visualize, all of the commonalities and shared heritage of all of that life. But now you can do it with fractals.
A new website launching today lets you explore all of the evolutionary tree of life, zooming in and out like you would use an online map. It’s called OneZoom and it’s built on a fractal pattern that repeats the same branching form, no matter how expanded or collapsed your view. James Rosindell, a professor in the department of Life Sciences at Imperial College London, conceived the idea and programmed OneZoom in collaboration with Luke Harmon, a biologist at the University of Idaho.
The project was somewhat of a happy accident, Rosindell said in an interview. Fascinated by fractals, the evolutionary biologist wanted to use a fractal zooming interface to display large and complex data sets, but it took a collaboration with Harmon to decide on the tree of life as his subject.
A tree is an apt metaphor for the history of life (among many other things) because it starts with a clearly defined beginning, offering both a timeline and a vast canopy of interconnected information. In a tree of life, the trunk generally represents the first life on Earth, and then it splits into boughs and branches for different kingdoms, like plants and animals. Those split into smaller branches, say for fish, mammals, birds and so on; and those break down into smaller and smaller twigs, representing families and groups, and finally leaves representing species. But try putting all of that information on a single tree, and it’s impossible, Rosindell said. It wouldn’t fit on a single page, neither a plant-derived one nor a digital one.
Rosindell said this prevents scientists and the public from fully appreciating the phylogenetic connections among millions of different species. While other scientists and data-visualization experts have visualized tree-of-life connections using other forms, like concentric rings, Rosindell believes a zoomable tree is a more comfortable-feeling interface. He said he was partly inspired by Google Maps, which offers a zoomable, pannable view with as much or as little detail as a user wants to see.
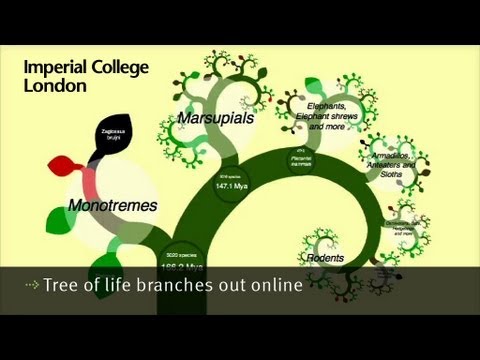
Tree of life branches out online
“A fractal view already has this implemented,” he said. “No matter how far you go, you get more and more information. What I would like to do is build the Google Earth of biology.”
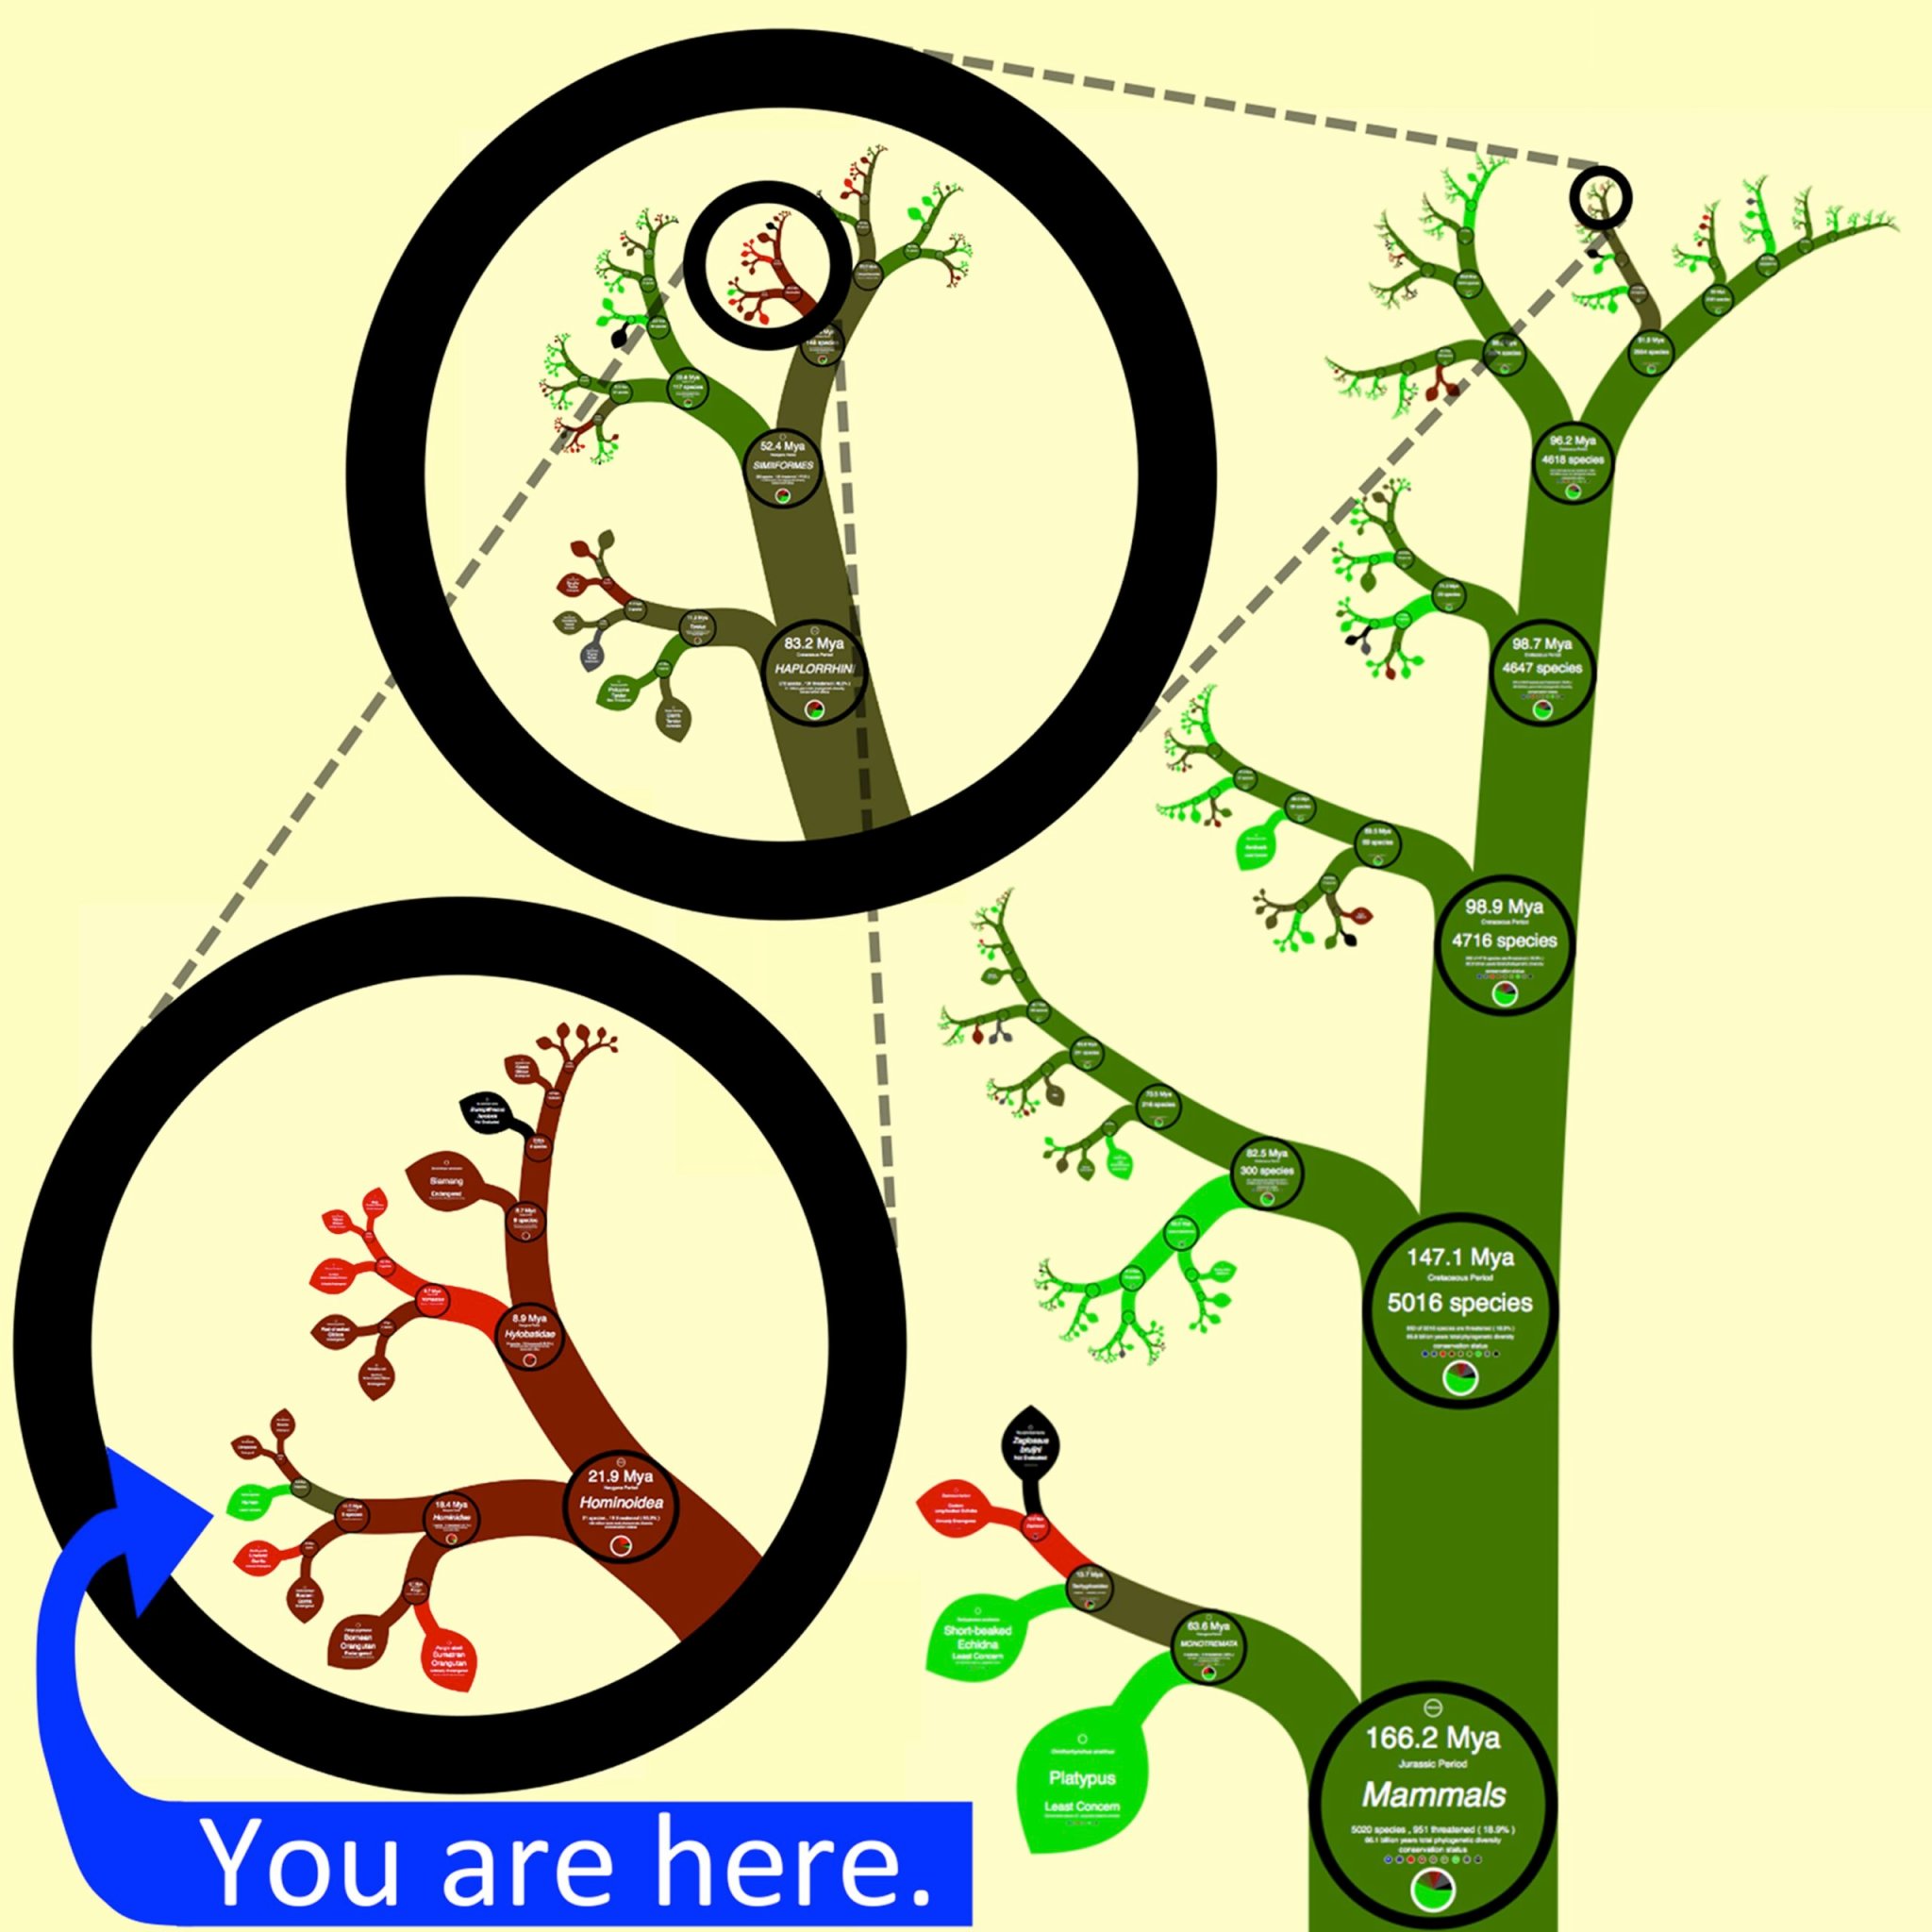
At its start, OneZoom looks like a tree, with a trunk, branches, twigs and colored leaves. Zoom in on the first branches, and you start seeing more detail. Around 166 million years ago, for example, you see that monotremes evolved, followed by marsupials and placental mammals. The tree spirals toward the future, with more and more branches representing more and more detail. The links between species serve somewhat like roads on a map, displaying clear connections. At the leaf level, you can tell which species are threatened with extinction–represented by red and green leaves–along with links to more information. Eventually, Rosindell will add photographs, too.
There’s no limit to the metadata it can handle, and you can even view it in different fractal forms, from a Julia spiral to a feathery tree.
The data comes from the open Tree of Life Project, a collaboration among biologists and other scientists around the world. It contains decades’ worth of work in phylogeny, evolutionary history of and relationships among groups of organisms. The project is about a year away from a complete tree of all life, Rosindell said. He wanted a system in place that could visualize it as soon as it’s ready.
Right now, OneZoom only contains mammals, but that’s still more than 5,000 species, all correlated with each other and color-coded according to their threat levels. Rosindell has big plans for the rest, and he even wants to build a searchable app for smartphones, showcasing the history and relationships between all life on Earth.
“What I’d like to do is visualize information about each species, information about each connection, with their intermediate forms, fossils, and all the wondrous information that exists about the history of life on Earth in one place,” he said.
OneZoom was scheduled to go live at 5 p.m. Eastern time today–check it out
here. A paper describing Rosindell’s and Harmon’s methods will be published in the “Cool Tools” series of the open access journal PLOS Biology.
