
Before astronauts can hike through Titan’s gentle hills or slide down its colossal dunes, they’ll have to know where they’re going.
Researchers have taken a major step toward the exploration of Titan, Saturn’s largest moon, by producing the first global map of the world’s icy plains, twisted canyons, and crinkled shorelines. The pathfinding chart, published Monday in Nature Astronomy, will form the foundation of more detailed maps to come, maps that will help scientists decipher the moon’s past and plan for its future exploration.
“Geologic mapping,” says David Williams, a planetary scientist at Arizona State University who helped produce the plot, “is basically another tool we use when we analyze planetary surfaces to try and understand their histories.”
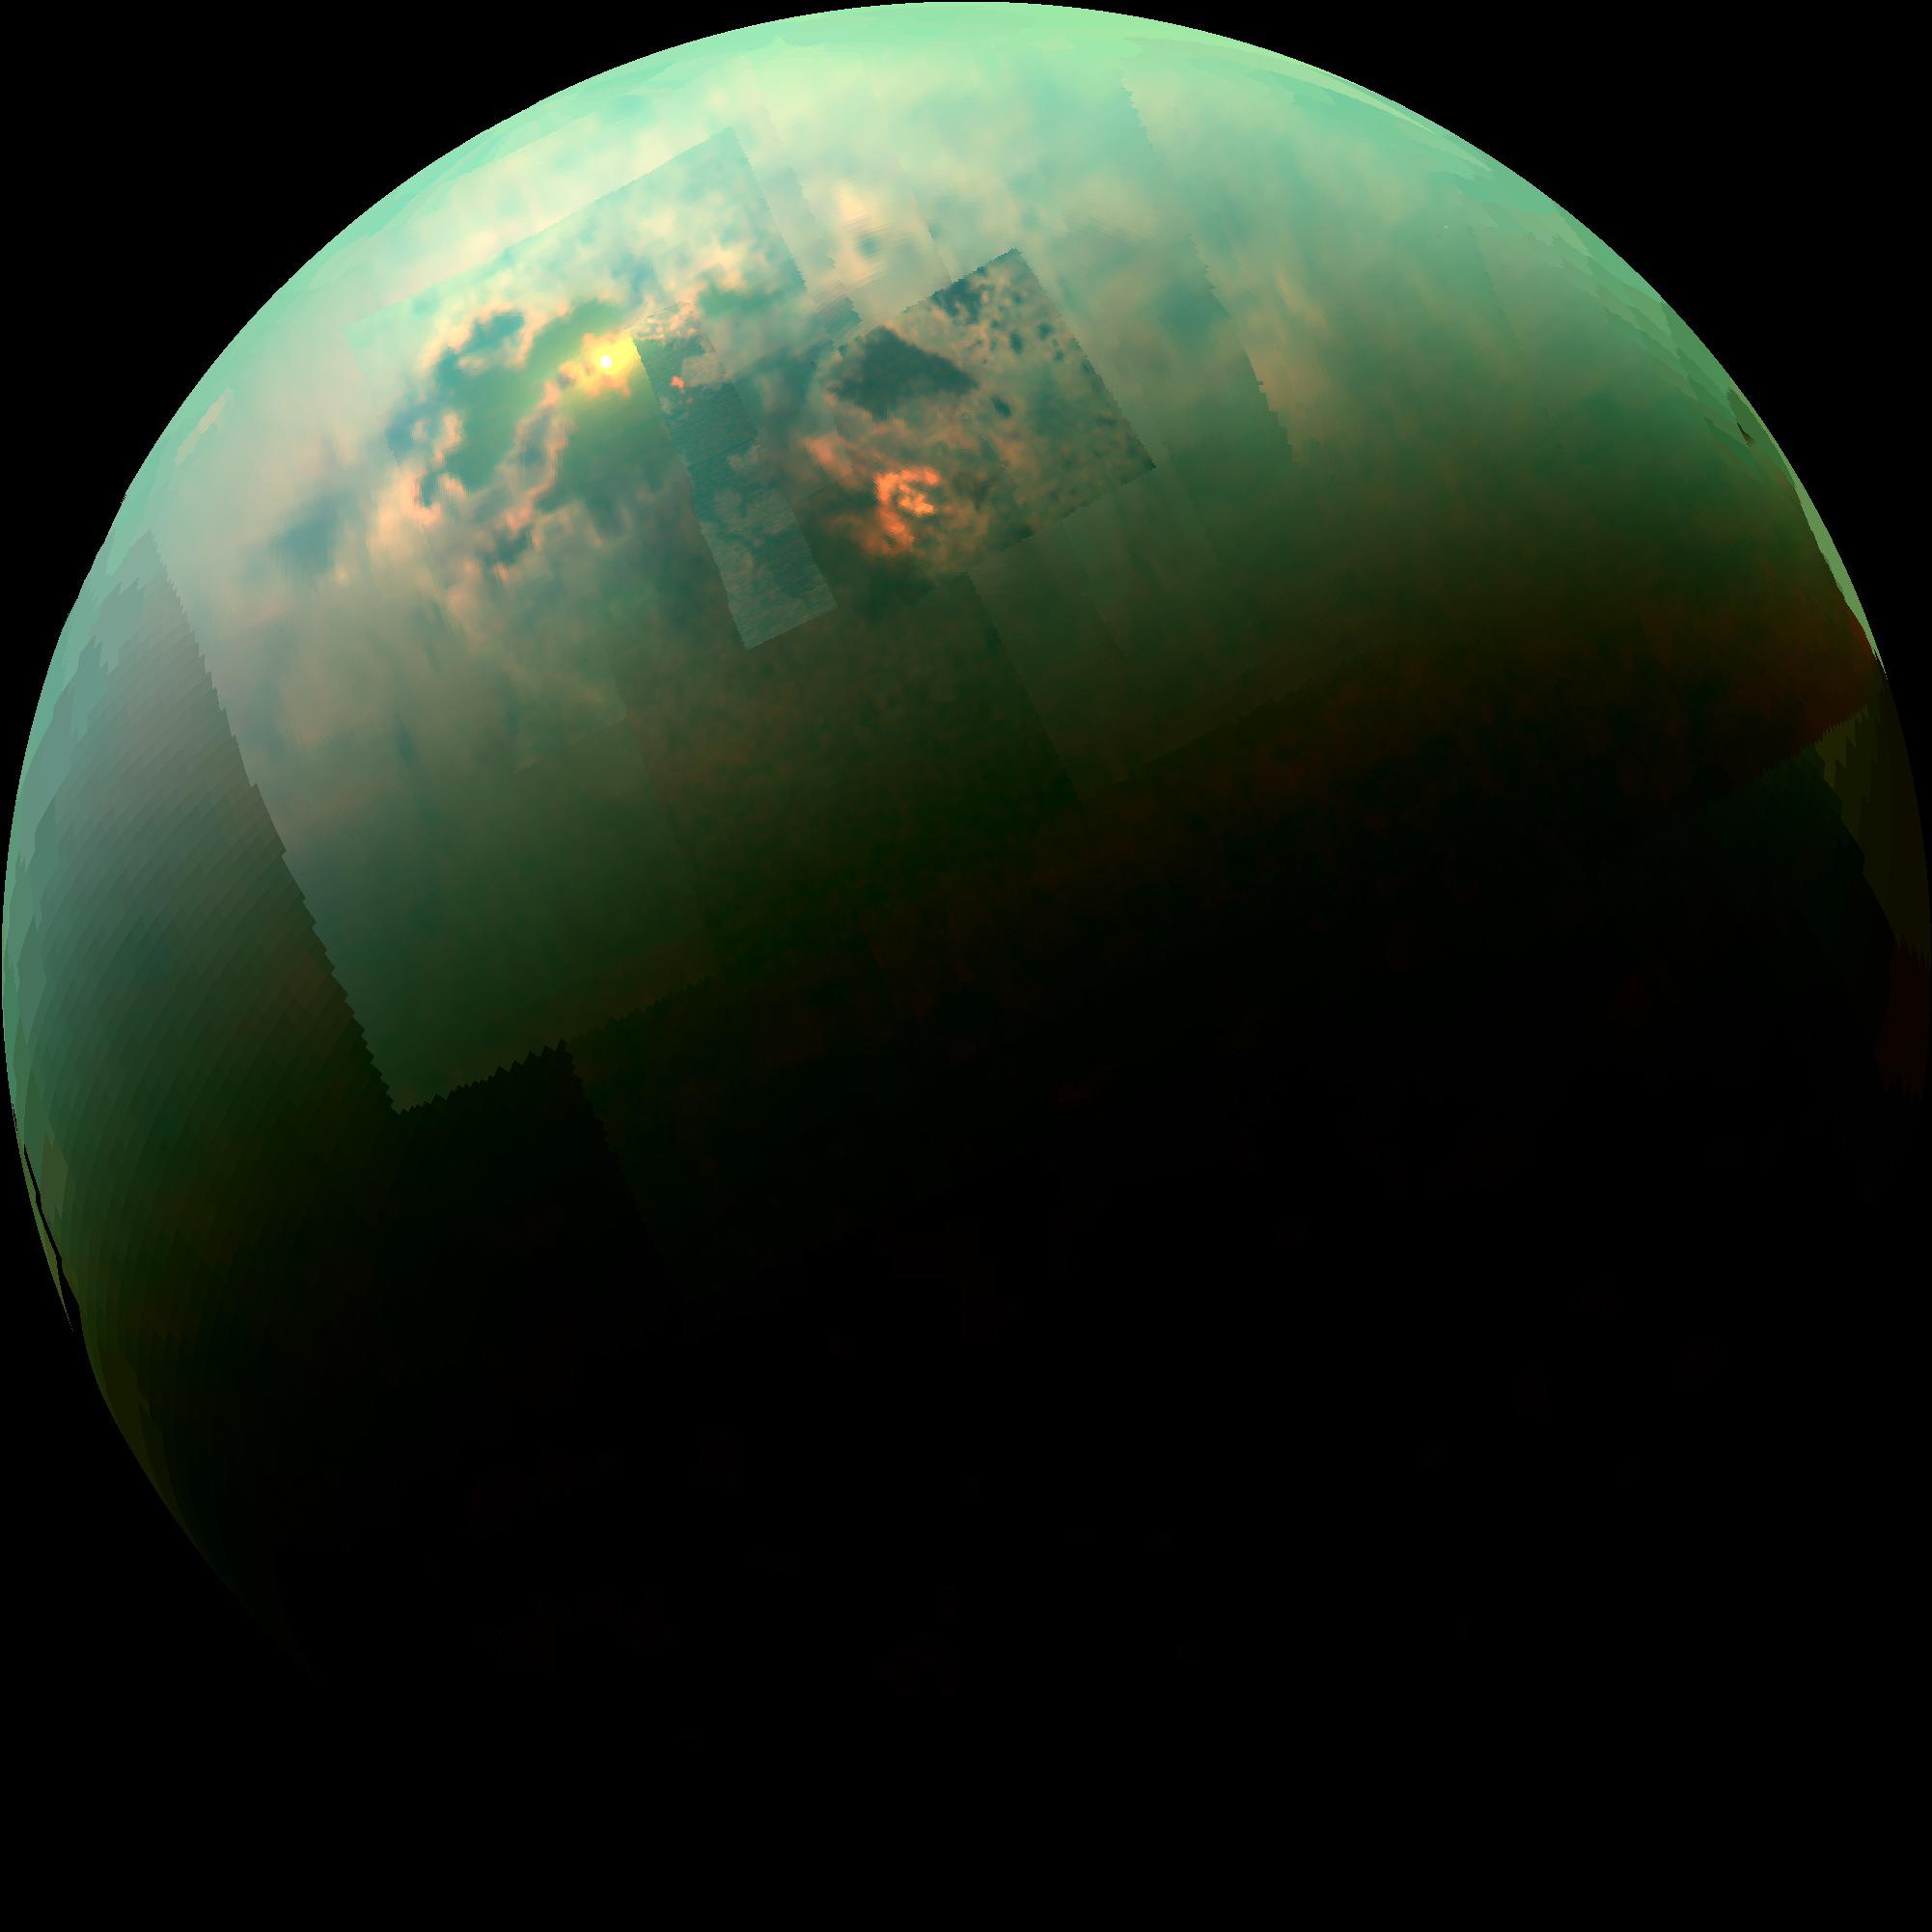
The Cassini spacecraft, which arrived in the Saturn system in 2004, gave researchers their first glimpse through Titan’s thick yellow clouds (the moon’s atmosphere is thicker than the Earth’s but almost all nitrogen and methane). The probe’s penetrating radar swept over the moon again and again during the next 13 years as it performed more than 100 flybys, revealing lakes, rivers, and other unmistakable signs of surface liquid—a first for any world other than Earth.
Williams and his colleagues started with radar imagery, where Cassini sent radio waves through the clouds to bounce off Titan’s surface in order to generate a map. This method covered slightly less than half of Titan’s surface in swooping, crossing tracts, but featured fine resolution the team could use to identify the moon’s different types of terrains, such as plains or dunes. They then overlaid that radar data with data from other cameras imaging visible and infrared light that were fuzzier, but covered the whole world, to learn how each landform appeared to each of Cassini’s various eyes. Finally, they used that global data from the other instruments to infer what types of land lay between the swaths of radar. “This particular map was focused on showing the variety of surface materials on a global scale,” Williams says.
The map reveals a world shaped by liquid and wind, although at nearly 300 degrees F below zero, no water flows on Titan’s surface. Rather, liquid methane and ethane fill Titan’s rivers and lakes, before evaporating and raining down again in an alien analogy of Earth’s water cycle.
Although that’s not to say the moon doesn’t have H2O. On the contrary, Titan’s surface largely is H2O. “The overall crust, like what people would walk on, what would make up continents on Earth,” Williams says, “in the case of Titan would be water ice.”

The team identified six major types of terrain carved from the icy crust: craters, lakes, plains, dunes, hummocks (hills) and labyrinths (canyons).
Here and there a few craters speckle the surface. Near the north pole lie the methane lakes, dark spots thrown into relief by sharp coastlines. Moving south, an explorer would encounter Titan’s most common landform: Plains, flat stretches of icy crust with a dusting of methane- and ethane-based sand, cover nearly two thirds of the world. Equatorial winds pile said sand into dunes hundreds of feet tall that stretch for hundreds of miles, circling the moon’s midsection and covering about one fifth of its surface.
Interspersed with the planes and dunes, lie “hummocky” regions of hills perhaps a few hundred feet high. Webs of cracked canyons dug by streams of methane from a wetter era cover much of the south pole—a sign of the climate change Titan has experienced as its orbit around Saturn, and Saturn’s orbit around the sun, change slightly over time.
“Over the geologic history of titan,” Williams says, “we see a sequence where the liquid accumulates at the poles and then is more dominant at the equator and back and forth.”
Further study of the chart and others like it in the future may eventually let researchers work out the movement of liquid on a seasonal basis as well. “Ultimately, we hope such maps will help explain the methane cycle on Titan,” says Imke de Pater, a planetary scientist at the University of California, Berkeley who was not involved with the research.
And better maps are well on their way. Although Cassini’s 2017 dive into Saturn’s atmosphere put an abrupt end to its steam of data, Williams says spotting and naming the major terrains was just the first step. He and his colleagues have already gone a step further, slicing the land into finer categories like bright plains and mountains, and produced a more detailed map. They plan to publish it through the US Geological Survey, where it will join other geological maps of extraterrestrial worlds including the moon, Mars, Ceres, and Vesta. (Maps of Pluto and Mercury are also in the works).
While it may be awhile before any human explorers will need these charts, a robotic scout may put them to good use before too long. NASA is developing a probe called Dragonfly that can navigate Titan by air, land on the surface, and take off again. The mission is scheduled to depart Earth in 2026 and arrive at the moon in 2034, where it will look for signs of alien habitability.
“This map will help inform that team of the nature of the geologic units around wherever it is that they’re planning on putting their drone to explore,” Williams says.
