From cities in the sky to robot butlers, futuristic visions fill the history of PopSci. In the Are we there yet? column we check in on progress towards our most ambitious promises. Read more from the series here.
In 1984, marine geologists finally got a long-anticipated glimpse of our planet unseen. After crunching satellite data for 18 months, a geophysicist at Columbia University’s Lamont-Doherty Geological Observatory, William Haxby, revealed a stunning new panorama of the seafloor. It was the first time anyone spied a worldwide picture of what lay beneath the ocean in such detail—volcanoes, underwater mountains, fracture zones, and trenches. “Haxby’s maps of the world’s seafloors reveal a terrain as diverse as any found on the seven continents,” journalist and science writer Marcia Bartusiak reported for that year’s February issue of Popular Science, capturing the scientific community’s palpable excitement. At the time, the Martian landscape was more familiar.
Nearly four decades later, the surfaces of distant planets are still better imaged than Earth’s ocean floor. While exponential advances in computer processing power, considerably expanded satellite imaging capabilities, and the development of autonomous (robotic) underwater vehicles capable of reaching even the deepest ocean trenches have advanced deep sea exploration, a high resolution map of the vast expanse of our own planet’s crust that lies hidden beneath a watery cloak remains incomplete. That may be changing, and none too soon with climate change bearing down. With ocean waters covering more than 70 percent of Earth’s surface, having a clearer idea of the shape and composition of the sea floor will improve our ability to predict storm surge in hurricanes, forecast the path of tsunamis, calculate glacial melt, and monitor struggling marine habitats subject to commercial practices like fishery management and deep-sea drilling and mining.
“Seafloor mapping is critical to pretty much everything,” says Caitlin Adams, Operations Coordinator at the National Oceanic and Atmospheric Administration (NOAA) Office of Ocean Exploration and Research (OER), “from national security to blue economy [sustainable ocean] initiatives.”
Ever since Russia’s Sputnik took to the sky in 1957, artificial satellite networks have employed electromagnetic waves like radar and Lidar to map terrestrial—and extraterrestrial—surfaces. But traditional radar works best on arid topography (like Mars, the Moon, and landmasses on Earth) because it can only penetrate a few meters into water, limiting the reach of eyes in the sky for waterlogged planets like our own. Since water mutes electromagnetic waves, there are only two ways to truly see beneath the sea without journeying down to the seafloor: sonar, or echo-sounding, and gravimetry, which detects gravitational anomalies caused by large objects. In both cases, direct measurement is required—the devices must be underwater (sonar) or at least close to the surface (gravity meter) to work, which means they can only be operated from the hull of a ship. Therein lies the rub. Mapping Earth’s 139 million square miles of seafloor could take as long as 1,000 years (estimates vary widely) for one ship continuously crisscrossing the ocean.
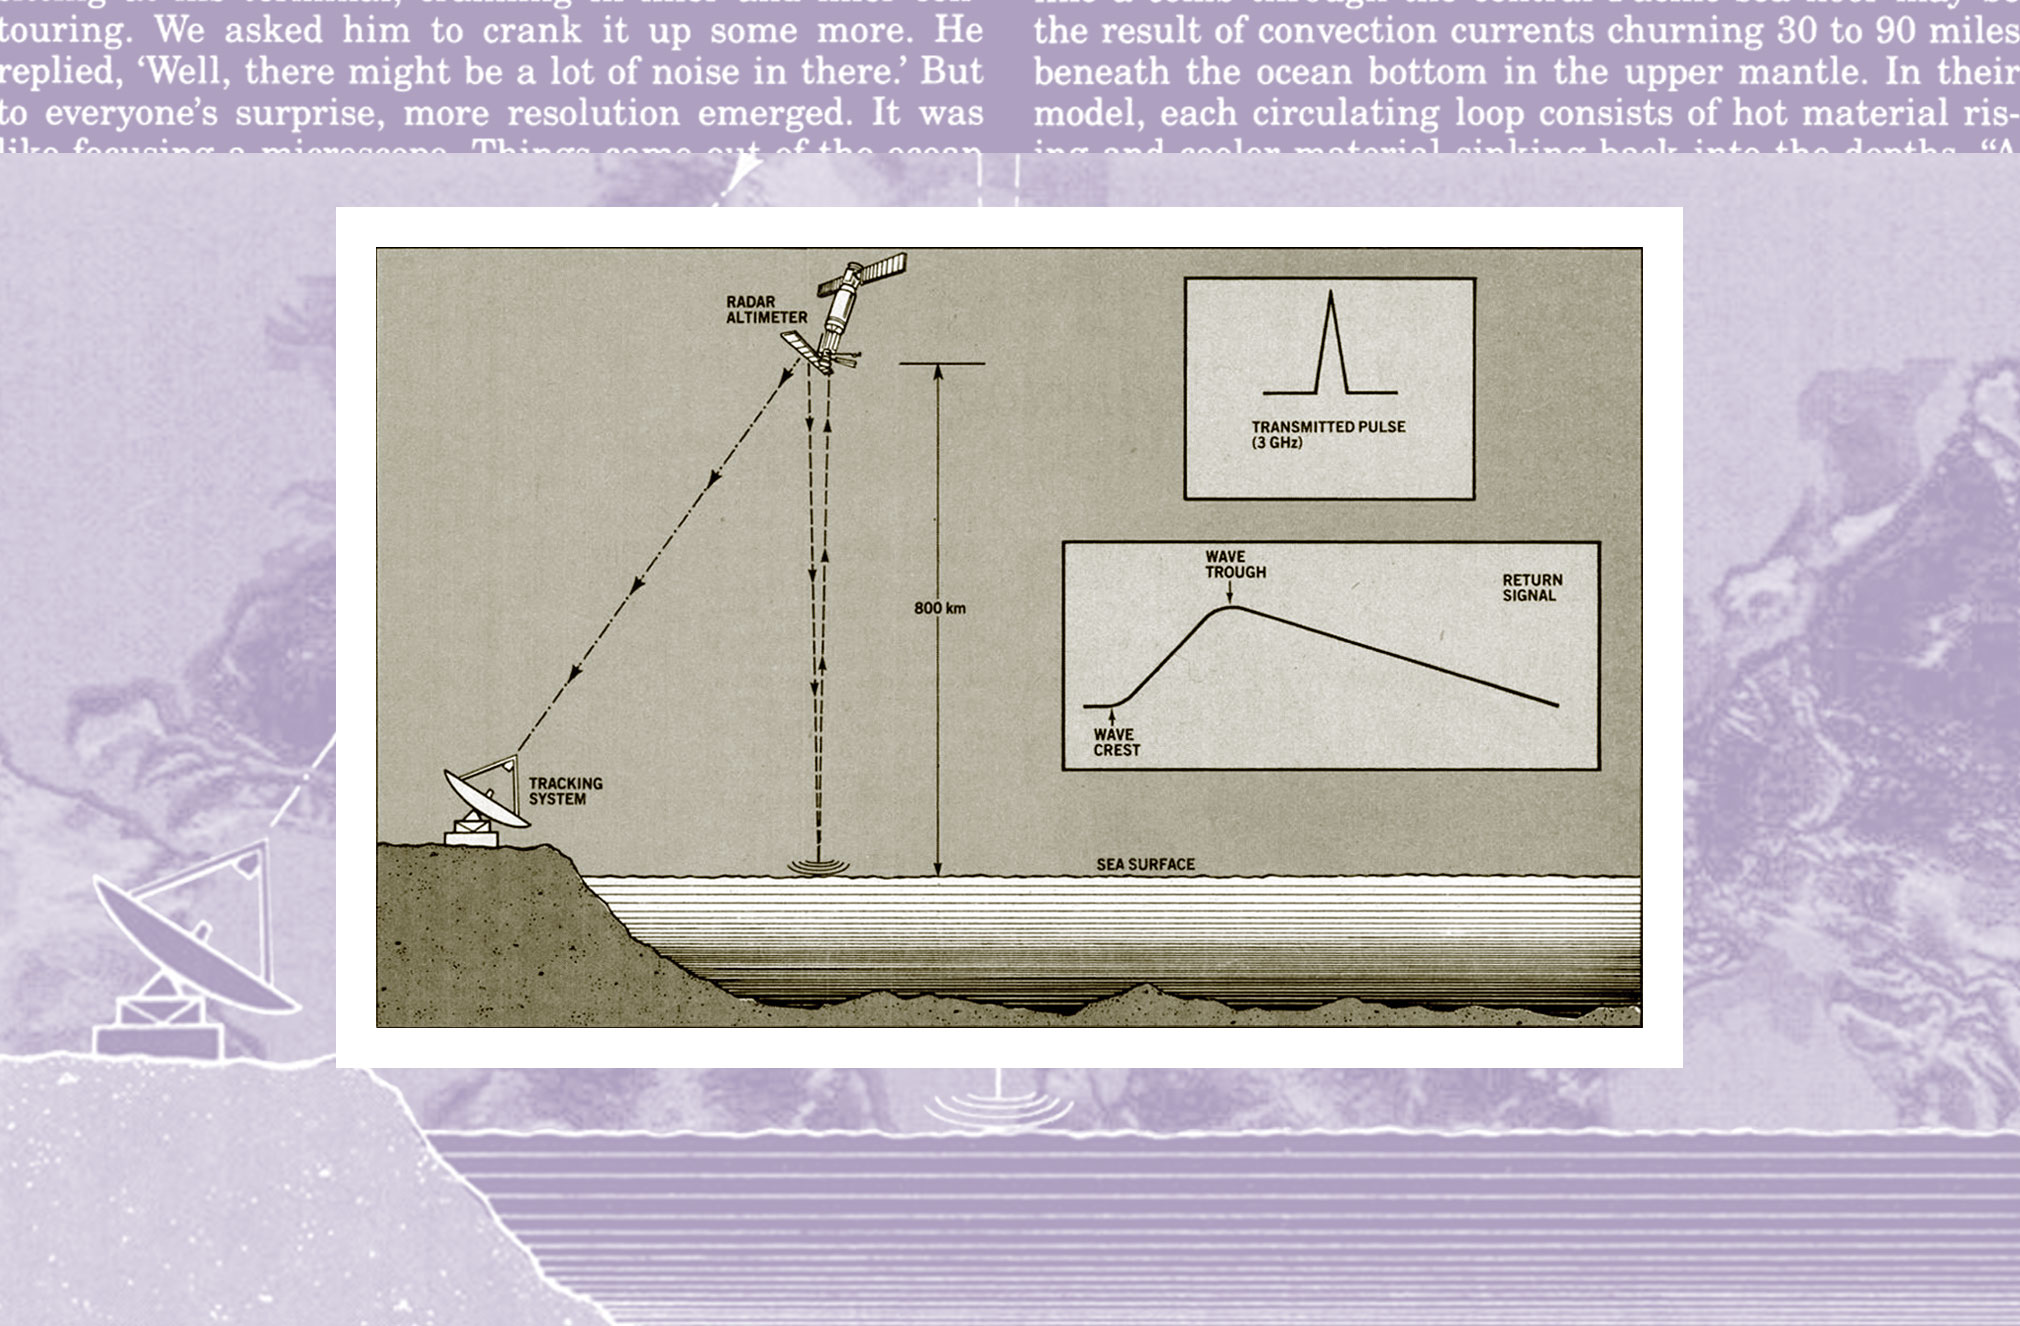
Enter satellites. As Bartusiak explained in PopSci, the 1984 breakthrough came from a combination of a new satellite measurement technique known as gravity mapping, or satellite altimetry, and improved computer processing power, which enabled Haxby’s team at Lamont to produce their novel seafloor map in just a few years.
Even without wind and waves, the surface of the Earth’s ocean is not like a fish tank: it would not be level. The ocean surface undulates, faintly following the ridges and rifts on the floor below. That’s because gravity’s sway over water becomes perceptible with masses as large as underwater volcanoes, underwater mountains (or seamounts), and trenches. Satellites equipped with sensitive altimeters, which measure sea surface height, can detect those subtle variations caused by seafloor topography. For instance, a 1,000-foot seamount will attract enough water to swell the ocean surface by as much as six inches. But since the ocean is a bit like a fluffy blanket, disguising all but rough contours, satellite-based gravity mapping has physical limitations. It can only detect large-scale objects, and then only approximates their shape. In 1984, exquisite detail in Haxby’s map meant that the smallest objects on the map were 20 miles across (about the size of Tanzania’s Mount Kilimanjaro). Anything smaller went undetected. While the precision of satellite altimetry has significantly improved in the ensuing decades, there’s only so much a blanket will reveal about what lies beneath. Today, the highest resolution satellite altimetry can achieve on its own is about 1 mile—or seven times the size of Egypt’s Great Pyramid. In contrast, terrestrial maps made from satellite imaging can be as detailed as 50 cm per pixel, or an object the size of a fire hydrant. Only sonar devices, mounted on ships and underwater vehicles, have the ability to produce high resolution seafloor maps.
[Related: Meet the marine geologist mapping the deepest point on Earth]
In 1912, when the Titanic sank in the North Atlantic, sonar had not been invented. The calamity inspired a flurry of echo-sounding innovation and in less than a decade sonar, which uses underwater sound projection to measure distances, became commonplace not only for maritime navigation and naval warfare but also seafloor mapping.
In 1957, Lamont researchers Marie Tharp and Bruce Heezen published the first comprehensive seafloor map of any ocean when they released their sonar-based physiographic map of the North Atlantic. It was like a crude ultrasound of the Earth’s ocean.
By revealing the major topographical features of the seafloor, some for the first time, like the Rift Valley of the mid-oceanic ridge, the map seemed to affirm German scientist Alfred Wegener’s continental drift theory, which had been dismissed when it was first proposed in 1912. By the late 1960s, and several sonar-based seafloor maps later, earth scientists had enough evidence to see that the planet’s surface had been fractured into sliding plates, just as Wegener proposed, drifting across the molten mantle below, crashing into one another, or slipping apart. Detailed maps of the seafloor held the key to plate tectonics. The consensus then, and now, was that more detail would reveal even more planetary secrets.
“When we see smaller features,” says Shannon Hoy, Expedition Coordinator at NOAA OER, “we start to get more knowledge of the underlying geologic and oceanographic processes that are affecting our world.” For example, Hoy, who works with autonomous underwater vehicles (AUVs), points to the “Million Mounds” deep-sea coral reef ecosystem, first mapped in the 2010s, that runs along the Atlantic seaboard from South Carolina to Florida. At a depth of 2,000 feet, the corals, which grow just a few meters high, live in the dark and are fed by the Gulf Stream. It is the largest known deep-sea coral reef. With some living corals as old as 700 hundred years, and thousands of years of coral skeletons at its base, Million Mounds has been likened to an old-growth forest, rich with marine life. “You wouldn’t have seen that with satellite data,” Hoy notes.
Sonar technology has advanced considerably since the 1950s and 60s. Today, multibeam systems project fan-shaped sound waves that can reach ocean depths of more than 6 miles. At depths of 2–4 miles, which represents nearly 75 percent of the ocean, multibeam sonar mounted to a ship’s hull can scan up to 5-mile swaths of seafloor at a time, delivering resolutions between 600–1,200 feet (the deeper the sounding, the lower the resolution)—considerably better than satellite altimetry. In shallow coastal regions, it can achieve between 100–325 foot resolution. And when mounted to AUVs, which get close to the sea floor, 1-meter resolution becomes possible.
In 2017, the United Nations held its inaugural Ocean Conference and declared the 2020s the Ocean Decade, challenging the world’s countries and companies to reverse the decline of the ocean. Among the global initiative’s 10 challenges is to “create a digital representation of the ocean.” At the time the UN made its announcement, only 6 percent of Earth’s ocean floor had been mapped and digitized using modern sonar. But a fresh initiative was announced at the conference to map the Earth’s entire seafloor by the end of this decade: Seabed 2030, a collaborative project sponsored by the General Bathymetric Chart of the Oceans, or GEBCO, and the Nippon Foundation of Japan. By June 2022, Seabed 2030 reported that 23.4 percent of the ocean had been mapped using modern sonar—almost quadrupling the coverage since 2017. Seabed 2030 collects sounding data from any ship willing to share, like NOAA’s research vessel Okeanos Explorer, which has enabled the map to be filled in so rapidly.
“Going from 20 to 23 percent in the past year sounds insignificant,” notes Adams, citing the 2021 percent-complete figure. “But it’s more than the size of Europe. Every year, we’re chipping away at it.” But these mapping efforts will need all the ships they can get to cut the centuries estimated to canvas the whole ocean down to the eight years left in the decade.
[Related: Jacques Cousteau’s grandson is building a network of ocean floor research stations]
“We don’t, as a project, have the resources to go out and do it ourselves,” says Jamie McMichael-Phillips, project director of Seabed 2030. “We do have the resources to take what people give us and put it on a map.” McMichael-Phillips credits Seabed 2030 with providing the inspiration that “encourages companies, industry, government, philanthropists, and scientists to go out and map the ocean.” Seabed 2030 will even supply recreational boaters who have sonar capability with a special device that captures the data from soundings, enabling them to participate.
McMichael-Phillips agrees with Hoy that the detail provided by sonar mapping, the gold standard for visualizing the seafloor, offers far more insight into our world than satellite altimetry ever could. He cites several examples, like the 2022 discovery by ocean mappers of one of the world’s largest coral reefs off the coast of Tahiti. The 2-mile-long reef was found at a depth known as the ocean’s dimly lit Twilight Zone, between 100–200 feet.
Still, GEBCO’s publicly available map—a jumble of thin lines representing sonar coverage—has a long way to go. While McMichael-Phillips doesn’t anticipate any technological breakthroughs with sonar or satellite that would expedite seafloor mapping, he does see help coming from uncrewed surface vessels, or USVs, like NOAA’s SailDrone. Having people aboard a vessel, he notes, is one of its most limiting factors, not only weighing it down but also requiring frequent stops for supplies and to avoid hazardous conditions. “I’m a former Royal Navy hydrographic surveyor. I spent a lot of time operating in the Southern Ocean in some pretty hostile conditions,” says McMichael-Phillips. “So by going down the uncrewed route, you remove that limitation.”
Hoy wouldn’t say whether she thought the Seabed 2030 project would meet its goal. “Ships are relatively small,” she notes, “and the ocean is very big.” But she credits Seabed 2030 with encouraging unprecedented data sharing and collaboration between organizations, creating momentum that will make a worldwide map achievable.
Whether 2030 is realistic, the 2020s may prove to be the decade that the richest and strangest image yet of Earth’s missing and unfamiliar contours will come together, like the slow reveal of a distant alien world beamed across a murky ether. “A direct measurement map of our complete ocean,” says Hoy, “is going to really change the face of what we know.”