The National Centers for Environmental Information get a lot of, well, environmental information. They gather an immense amount of climate data, and in order to organize it all, they sit down on the 4th of every month to review everything that’s come in. It was at this meeting in December 2017 that the folks at NCEI noticed something: Utqiaġvik, Alaska was missing. Not the town itself, of course, but its data. All of it.
But this isn’t a who-dunnit caper about the case of the missing numbers. The analysts at NCEI quickly realized that the data wasn’t so much “missing” as it was eliminated.
The “climate centers” across the United States that feed NCEI its information can vary a lot in type. Many of them are basically small weather stations at airports, where volunteers periodically write down readings and send their logs to NCEI. With all that info coming in from sources so far out of their control, NCEI record keepers have developed an algorithm that automatically throws out data points it suspects are wrong.
There are lots of reasons that a station might start reporting incorrect information, most of which are innocent. Maybe the box holding the sensors was changed from wood to metal, or maybe a volunteer had to move it a few yards down the road, putting it in a sunnier area. Maybe it was brought down a mountain road, leaving the sensors sitting at a lower elevation. Maybe the person in charge of taking the readings started getting up an hour later. These will cause tiny changes in the daily readings, but if the data from that station are consistently half a degree higher in 2017 than in 2016, that starts to look more like a trend. Some might even call it climate change.
In an ideal world, a station reports these kind of changes so that NCEI knows the data isn’t fake, just a little different. But there was no such report for Utqiaġvik. It’s a pretty conservative algorithm, because climate data is messy and there can be a lot of variation, which means Utqiaġvik—formerly known as Barrow, Alaska—had to be way out of whack to get flagged. (Technically speaking, Barrow was formerly formerly known as Utqiaġvik. The town voted to change back to the area’s original native name in 2016.)

But the warming happening in Utqiaġvik was real. Over the course of 2017, readings were consistently coming in very hot, so to speak, and the algorithm was slowly building a case against the station. By December 4, 2017, it had determined that all the data from that year (plus a few months from 2016) were probably wrong in some way.
This decision wasn’t based on comparing modern data to older information. The algorithm actually compares across stations to figure out which points might be off. There are enough NCEI stations that the algorithm can look at nearby data points to see whether they are also following the same trend. This is kind of brilliant for a system that has to be able to show significant changes in temperature over time due to global warming, but also has to detect outliers. If the readings from station A are much higher this year than last, but the readings from surrounding stations are higher by about the same amount, we can infer that the data is real. The Earth is warming.
So Utqiaġvik didn’t get thrown out just because it was so much warmer in recent years—it got thrown out for heating up at a faster rate than surrounding stations. And admittedly, part of the problem is that there aren’t a ton of climate stations north of the Arctic Circle. To run one, you need people to live there who can collect the data, and Barrow is the northernmost point in the entire U.S. It’s not exactly a hopping area.
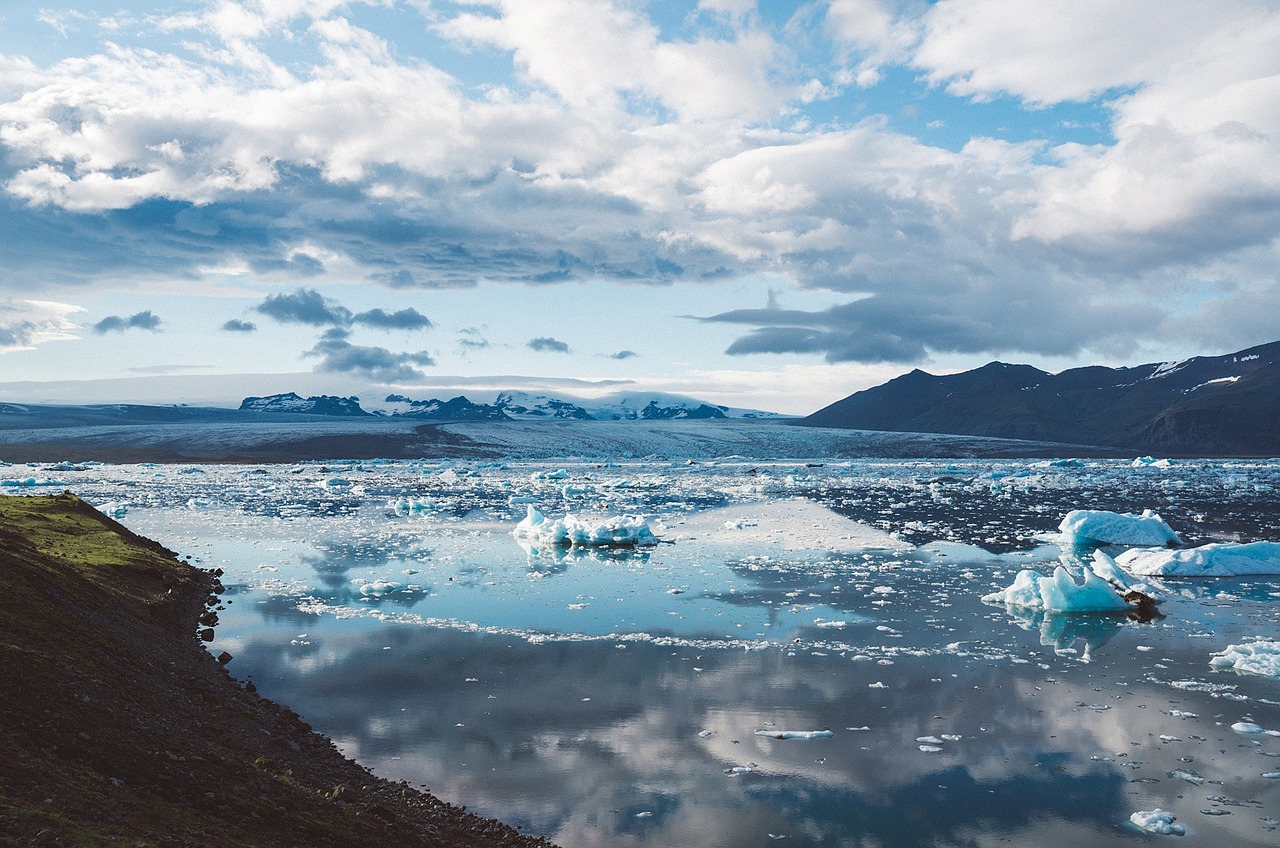
But this is also a problem because we know that climate change is disproportionately affecting temperatures at the poles. It’s warming twice as fast in the Arctic as it everywhere else, which is why sea ice is changing so rapidly up there. That station in Utqiaġvik is one of our only windows into how our northernmost climes are evolving, and it’s changing so rapidly that our algorithms can’t keep up. October, November, and December in particular have been 7.8°F warmer than they were from 1979-1999. The other nine months of the year were 1.9°F warmer, which is twice the increase that the lower 48 saw in that same era.

Fortunately, that data isn’t all gone. It got thrown out from the dataset used to calculate monthly average temperatures and such, but the points themselves weren’t deleted. The analysts at NCEI have since added them back in, and are working on adjusting the algorithm to account for even more rapid change up north. They’ll figure it out. They can correct for this new data. The real problem is that they have to in the first place.
The basic plan for how to change the algorithm is to specify that areas above about the 65th parallel north, which is basically northern Alaska, will be given more leeway. If the Arctic is changing this rapidly, they’re going to have to adjust expectations. Because at this point, it’s too late to do much else.
