When Hurricane Irene hit the East Coast in the summer of 2011, it was supposed to be a doozy. The subways were closed, people evacuated and stores boarded up. But although there was significant damage, the storm wasn’t anywhere near as strong as predicted. But a year later, as Hurricane Sandy made landfall in New Jersey on Oct. 29, 2012, scientists realized they had the opposite problem: They had severely under-predicted the amount of water it would bring with it.
As hard as meteorologists work to forecast storms accurately (even flying planes straight into storms to collect data), predicting hurricanes and tropical storms remains an imprecise science. Particularly when it comes to figuring out how strong a storm is going to be when it hits land, we have a ways to go. But storm-tracking robots, both above and below the storm, can get us the observational data to change that.
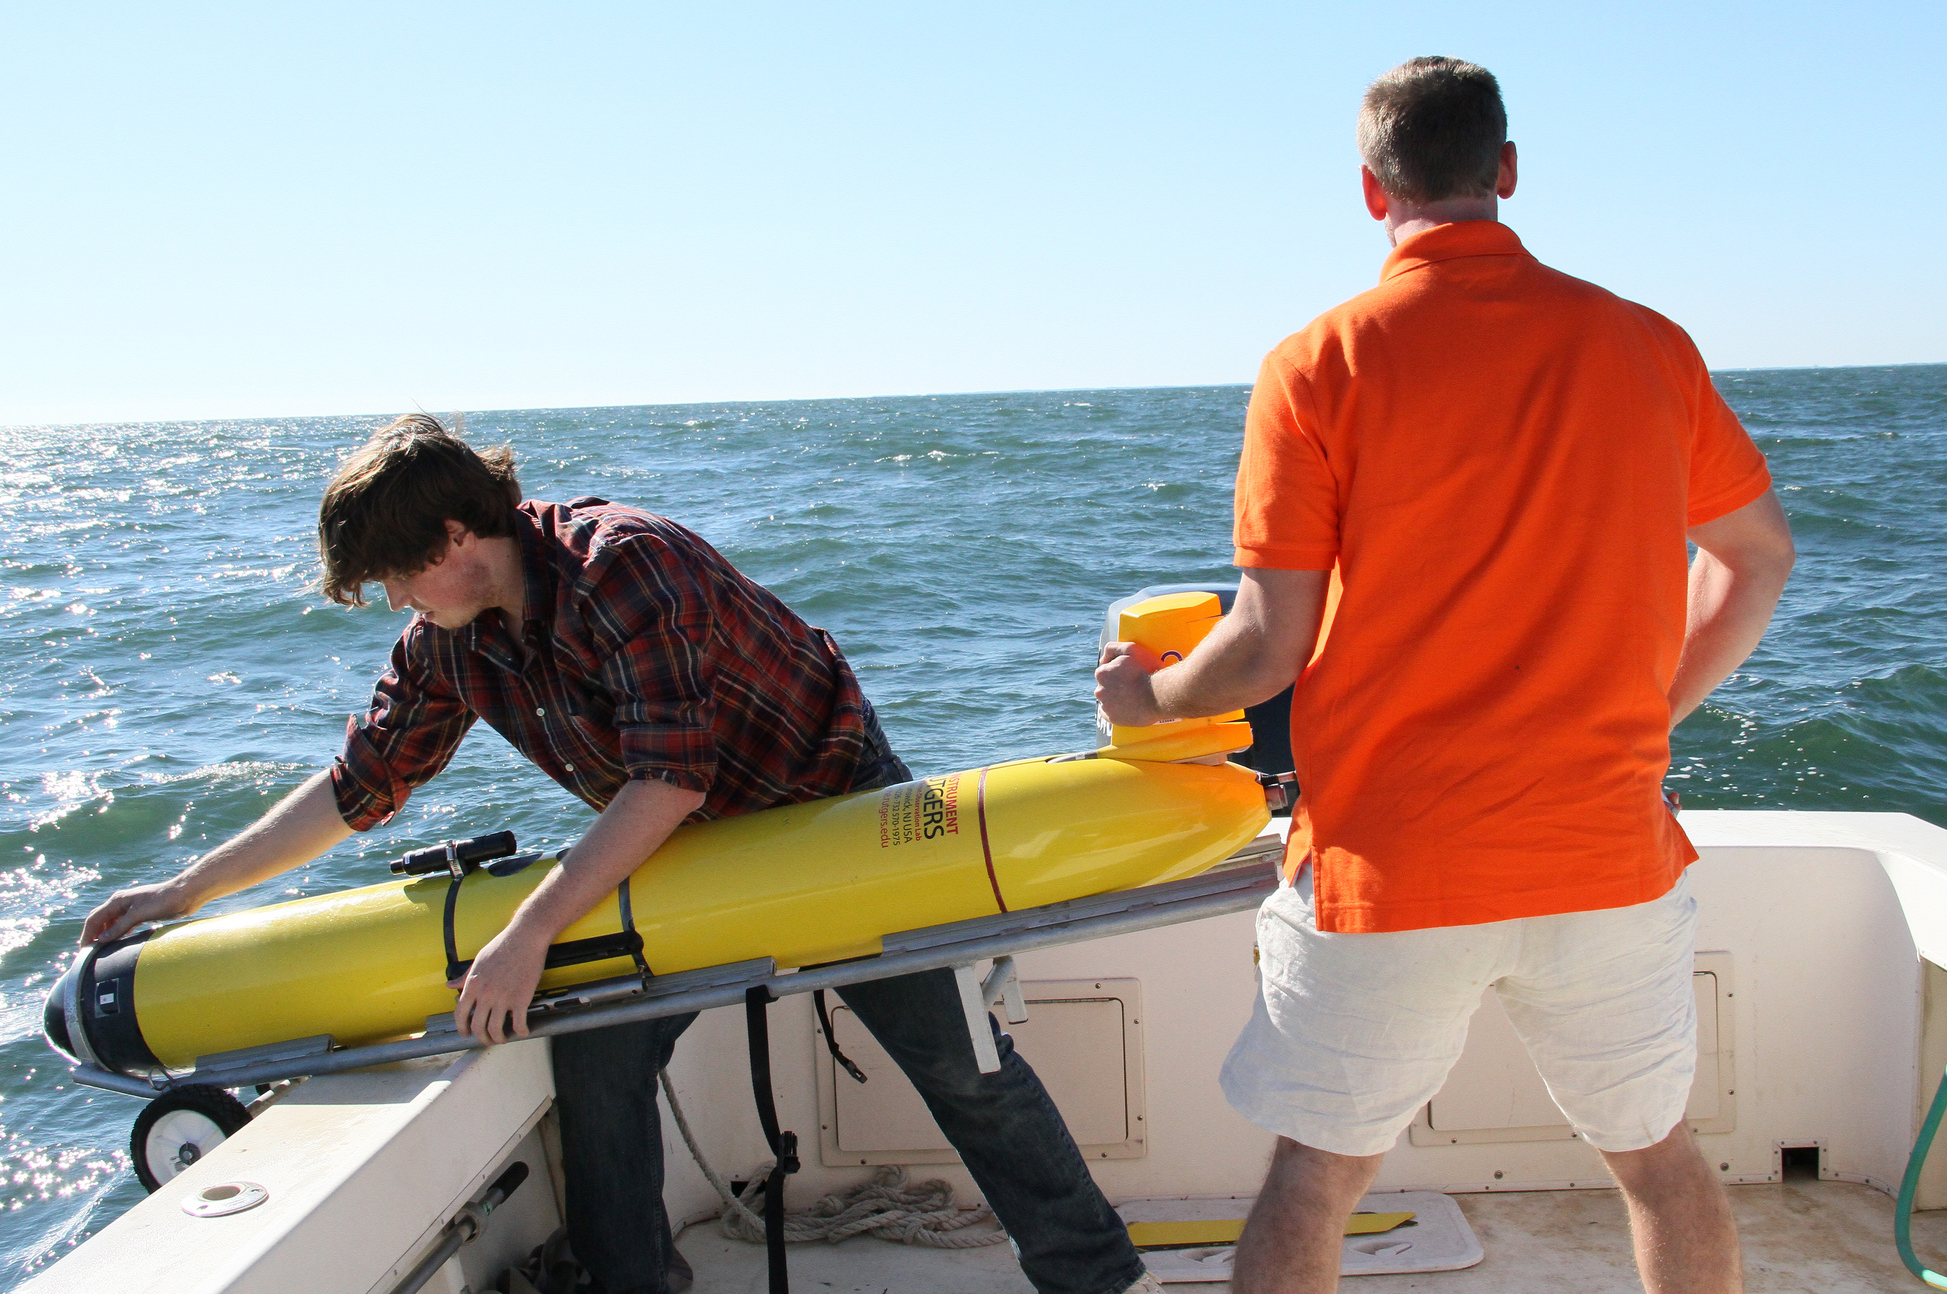
At Rutgers University, the Coastal Ocean Observation Lab (COOL) is working to make hurricane modeling more accurate by deploying a fleet of relatively cheap, buoyancy-driven underwater gliders that can get right up under the eye of a storm to gather real-time data on what’s happening in the ocean below, like how temperatures are changing at different depths. Researchers are analyzing data gathered by these gliders during Irene and Sandy to try to figure out what makes the difference between a relatively weak hurricane and a superstorm.

“The overall idea is to use these [data] to validate some of the models, because there’s really limited observations in the ocean during storms,” Rutgers Ph.D. student Travis Miles told me. Traditionally, one of the few ways to gather ocean data during a storm was to put out moored buoys ahead of time and hope the storm would pass over them. Or you could fly a plane into the storm and drop sensors into the water. Or you could sit out on a boat during a hurricane (just kidding don’t do that). Those techniques are expensive and limited in the amount of data they can collect, since the sensors can’t travel to collect observations from different locations and depths. “There’s not a ton of other ways to collect ocean data with high temporal resolution,” Miles says.
‘There’s really limited observations in the ocean during storms.’
That’s where the gliders come in. The 6-foot-long, 115-pound autonomous underwater vehicles (AUV) carry instruments to measure water temperature, depth, salinity and more, and can operate for months at a time, collecting continuous streams of data from all different depths and beaming information back to the lab via satellite phone every time they surface. They’re battery-powered and driven by changes in buoyancy, using wings to recreate the mechanics of flight underwater rather than propelling themselves like a submarine.
How it works (video explanation here): A piston in the nose of the glider pulls back, letting in a little bit of water into the nose. This increases the weight of the nose, angling it toward the ocean floor. The wings on the body make that downward movement into a forward glide, like a bird swooping toward the ground. To come back up, a piston pushes the water back out, making the glider more buoyant and pushing it toward the surface.
With this seesawing motion propelling it both horizontally and vertically through the water, a glider can travel at a slow but efficient clip of about 10 to 20 kilometers per day. In contrast to some other robotic underwater sensors, like these gliders the National Oceanic and Atmospheric Administration tested last year that could log water temperatures 23 feet from the surface, these gliders can travel to depths of up to hundreds of feet. Combined with traditional data sampling methods like moorning buoys, they can paint a more detailed, 3-D picture of ocean conditions before, during and after a storm.
“The real power of all these things is they all have different ways of sampling through space and time,” Scott Glenn, one of COOL’s co-directors, told me. “It’s really the power of putting them all together that you really go after this unseen world.”
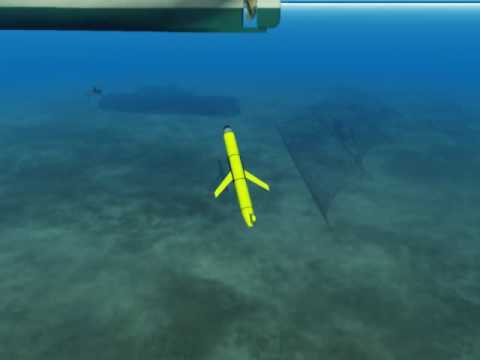
Glider Flight Animation
The lab is currently analyzing data from Hurricanes Irene and Sandy to try to improve how hurricane models incorporate the ocean’s response to a storm. “The way a lot of the models currently work is, they assume something about what the ocean actually looks like,” Miles explains. “What we’re trying to do is actually include real ocean physics validated by observations into those atmospheric models to actually improve their intensity forecasts.”

For example, knowing how temperatures are changing deep in the ocean as a storm passes through can tell scientists whether the water is going to act as an engine intensifying the storm or put the brakes on it. “The ocean is your heat driver. It’s your engine for hurricanes,” Miles says.
“In Hurricane Sandy, you can see the bottom temperatures off of New Jersey went from 10 degrees Celsius to near 18 degrees Celsius,” he explains. During Sandy, COOL had a glider out right under the eye of the storm. “That’s the equivalent of going from summer conditions to winter conditions in two hours.” By contrast, during Hurricane Irene, the glider data shows the waters cooled down drastically, de-intensifying the storm. “In Irene, we saw there was an escape route for the storm surge,” Glenn explains. Because it was still summer, the ocean was stratified, with a warmer layer of water on top and a colder layer below. Churned up by the hurricane, the cold water at the bottom of the continental shelf cooled the warmer water at the surface, weakening the storm and reducing the storm surge, the wind-driven ocean water that piles up on shore during a hurricane.
Without this kind of data to indicate how the temperatures are changing throughout the ocean, though, forecasters can’t tell what’s going to happen. “If you don’t include that process, you just assume the process is warm,” which can lead to over-forecasting the storm’s intensity, he says.
Right now, there are currently a handful of gliders deployed up and down the Atlantic from Nova Scotia to Georgia for Gliderpalooza, a two-month effort between multiple universities as part of the U.S. Integrated Ocean Observing System. They’re scheduled to collect data until the end of this month, during the peak of fall storms in the Atlantic, to help improve hurricane intensity models further.
By giving us higher-resolution data from across the ocean depths, these gliders could help us tell the difference between the next big storm and a false alarm.
