
This past weekend, a major blizzard blanketed the East Coast powdery white. In some places, winter winds whipped past 70 miles per hour, while flurries piled on more than 12 inches of ice. But even as the high winds and low visibility grounded more than 5,000 flights at airports throughout the Northeast, two small planes decked out with sensors and scientific equipment remained in the air, racing after the storm as it swept up the Atlantic Coast.
The pilots, technicians, and researchers on board had to simultaneously operate the craft and instruments, while carefully listening to directions from team members on the ground. “Imagine, you get this information firehose, and you’re in a plane in turbulence in a snowstorm,” says Sandra Yuter, a weather and climate expert at North Carolina State University, who was the lead mission scientist overseeing the flight from the ground. “It’s very intense; you come back and are absolutely exhausted.”
The flight was a part of a second round of aerial storm-chasing experiments that started in 2020, conducted for NASA’s Investigation of Microphysics and Precipitation for Atlantic Coast-Threatening Snowstorms, or IMPACTS. Soaring through and above the clouds, the two research planes have the unique advantage of gathering data directly from blizzards as they unfold, giving a new perspective on how the phenomena form and develop.

By understanding the nature of these winter storms, this team of atmospheric scientists can help improve predictions of potentially dangerous snowfall levels. “We know a lot about the general structure of storms, but what we don’t know is why exactly the intensity of snow is distributed the way it is for each storm,” says Lynn McMurdie, an associate research professor at the University of Washington and principal investigator of IMPACTS. The project focuses on winter weather events in the mid-latitudes of the Northeastern US. Mid-latitude storms happen year-round, but are weaker in the summer and usually result in rain because the warmer temperature in the lower atmosphere melts the snow as it falls, McMurdie explains.
Linking snowfall to an elusive winter weather phenomenon
Snowstorms in the Northeast often make travel dangerous, cause whiteouts, and create emergency blizzard conditions. But forecasts are notorious for having big gaps in their predictions, including the ones for this past weekend’s storm. “They were going all over the place,” says McMurdie, who also worked on ground controls on the mission. “We knew it was coming. We just didn’t know, okay, is it gonna wipe out New York? How far inland? Was it going to all stay offshore?”
The timing and regions hardest hit are often difficult to predict, especially when looking too far ahead of the event, says Yuter. “Often when you get a snowstorm forecast, it’ll say something like 3 to 8 inches, and the snow is expected to start sometime in the afternoon continuing into the evening. That’s an enormous range,” she says.
One way to help narrow some of this variability in models is to unpack the formation of an understudied weather phenomenon—snow bands. These long, narrow ribbons can dump large amounts of snow and precipitation in their wake. “We’ve always been aware that the precipitation distribution, whether it be rain or snow, in a storm isn’t even,” McMurdie says. “Not everybody gets the same amount everywhere for the whole storm. But one of the ways it could become variable is from these narrow bands”

Generally, there are two common types of snow bands: primary bands that are often very long and can cover multiple states in length, and multi-bands that occur in a series of smaller rows and are about the size of a couple counties. The type of snow band and how active it is might influence why one city accumulates many feet of snow, while a town nearby only gets a couple inches, Yuter explains. But both kinds can yield a lot of precipitation.
That’s why the team is examining if properties of the particles in clouds—like size, water content, and quantity—might contribute to snow bands with heavier snowfall. “Everybody likes to think that snow is always these beautiful star-shaped dendrites, but it’s actually very messy,” McMurdie says. “One of the things that can happen is a storm has a lot of upward motion, and it’s very vigorous. As the air goes up, it cools and condenses, and you make small tiny water drops in the cloud.”
These small water droplets glom onto other ice particles in the cloud to make snow, which is picked up by radar reflectivity seen on weather forecasts, she says. But the higher-intensity radar colors don’t necessarily indicate more snow for an area. “There are a lot of factors that go into it,” McMurdie explains. “The [bright radar readings] may just mean there are bigger snow particles.”

Once snow forms in clouds and atmospheric bands, it might take another hour or two until it reaches the ground, Yuter says. As it falls through different environments in the sky, the particles can transform, giving even more clues about the conditions of a snowstorm.
“Every storm is different,” says McMurdie. “Some storms don’t really have that much of a banded structure—but it still snows pretty good. The one this weekend had bands everywhere that were going crazy. And we’re like what is going on here? We don’t know what to make of this.”

Hunting for clues during a whiteout
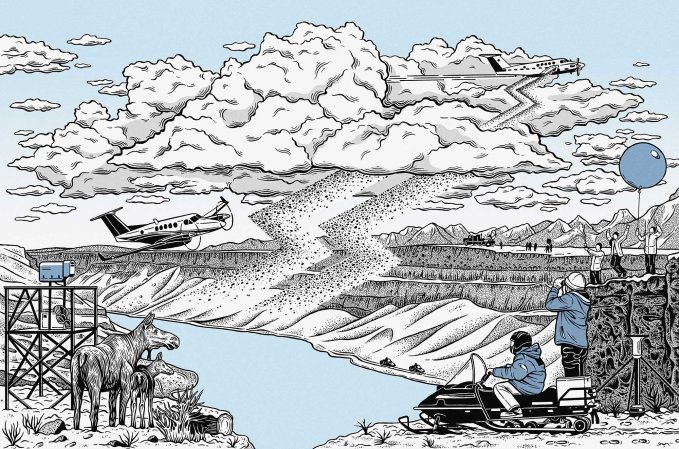
Snow band patterns have long been seen on weather radar and sensors, but experts haven’t been able to pin down why and how they form. To better understand their dynamics, the IMPACTS team utilizes two NASA aircrafts: the P-3 Orion aircraft and the high-altitude ER-2 plane. The P-3, a four-engine turboprop, flies up to 26,000 feet, cutting through the clouds to collect snow particle samples as well as temperature, humidity, and other atmospheric measurements.
The ER-2, on the other hand, shuttles above the storm at about 65,000 feet and uses remote sensing equipment similar to those on weather satellites. Because the plane can fly closer to the storm than satellites in orbit, it’s able to capture data at a higher spatial resolution. All the while, teams on the ground follow the storm’s path with radar that measures cloud properties.

Preparation begins days in advance so that the planes can be moved to airfields that are safe enough to take off the day of the storm. With the nor’easter on January 29, the team decided to move the P-3 from its base in Wallops, Virginia, to an airfield near Dayton, Ohio. The whole flight took about eight hours, with about six spent in the thick of the storm. Typically, snowstorms make for a smooth ride, Yuter says—but the planes encountered surprising turbulence as they flew over the Gulf of Maine this past Saturday.
“Often when you make observations, you have some initial ideas, but Mother Nature surprises you,” Yuter notes. “This was definitely a case where we were surprised how turbulent it was in what looked like a weakening storm.”
The reason behind the rocky ride remains a mystery, says Yuter, but the IMPACTS crew might get answers after the readings and samples are analyzed. The team has been following the major winter storm currently brewing across the US with flights scheduled for the Midwest on February 3 and for the Northeast on February 4. They plan to continue running flights through February as they explore the potential connection between snow bands and snowfall. With more advanced technology, the mission has the opportunity to provide a new data set that could show how snow bands factor into forecasts, McMurdie says.
“We can’t stop [snowstorms] from happening, but if we can forecast them with less uncertainty,” she adds. “Then people could be prepared for an appropriate range of conditions.
“Hopefully we can make forecasts better in the future.”


