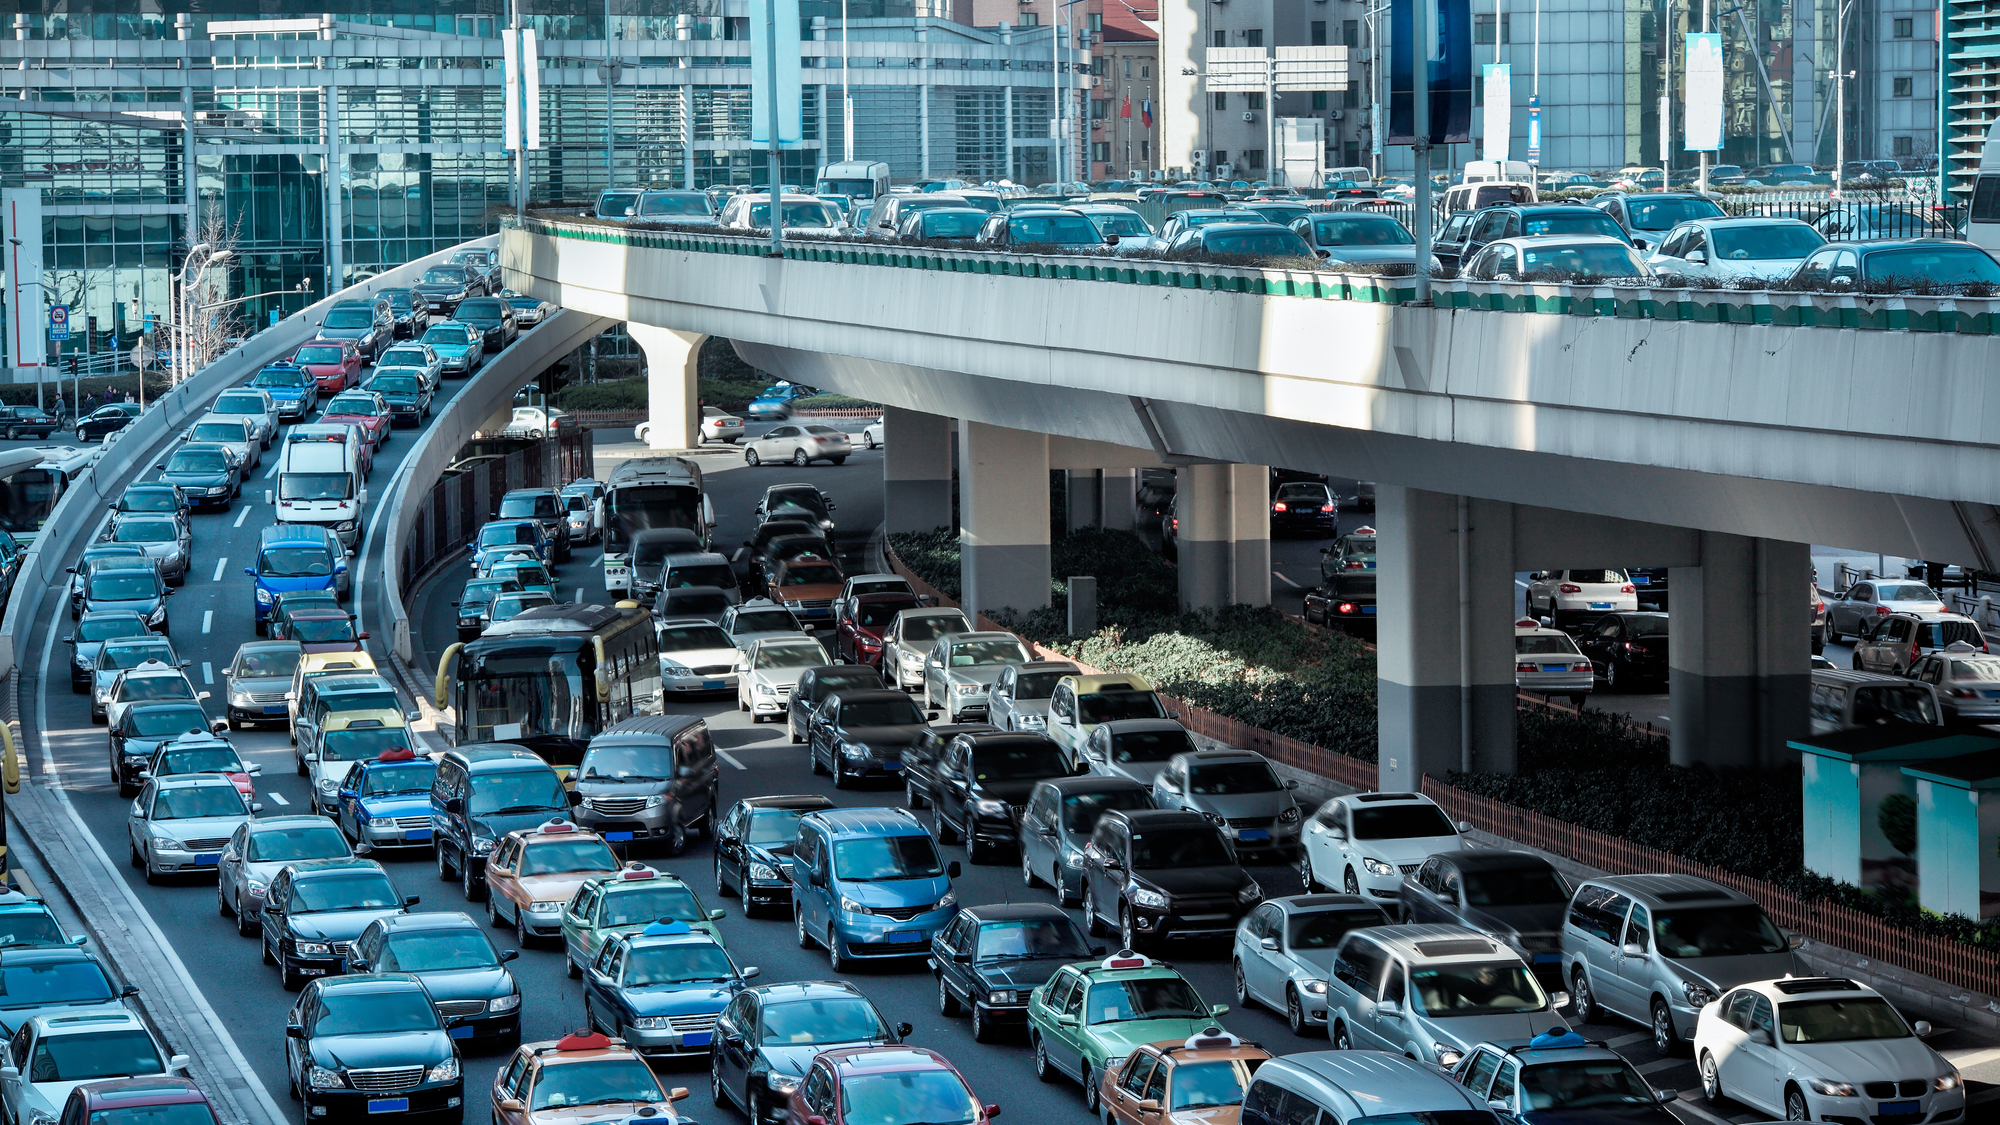

The mapping service and tech providers at TomTom have released their annual global traffic index, and most cities remain costly pains in the trunk to navigate in a vehicle. In their 56-country survey, TomTom researchers assessed 389 cities and metro areas for their average rush-hour travel times, fuel costs, and CO2 emissions to identify the trickiest towns, as well as a handful of car-friendly locales. The team also included a fuel cost and CO2 emission calculator for gas, diesel, and EV to keep everyday drivers, urban planners, and policy makers informed.
[Related: Roads in the US are getting deadlier.]
According to the report, traffic data such as speed, acceleration, time, and distance were provided to TomTom via their products and services to identify patterns and averages. They then combined the traffic info with map data such as slopes and road health alongside the Graz University of Technology’s “Passenger car and Heavy-duty Emission” (PHEM) Model to estimate fuel consumption. A machine learning model was trained on these data sets, and then used to estimate global emissions and consumption on a total of 543 billion km of its database’s floating car data (FCD).
So how do the cities stack up? London remains the worst city to cruise by far, averaging over 36 minutes to traverse just 10km (roughly 6 miles) of roads via car, and nearly two minutes longer commute times from the prior year. Bengaluru, India, came in a distant second place, averaging a little over 29 minutes for the same distance.
The first American town to show up on TomTom’s ranking is New York City in 19th place, which takes residents around 24-and-a-half minutes to travel 10km in a car. As for stateside cities in general, Washington, San Francisco, Boston, and Chicago all also scored relatively poorly.
[Related: Pittsburgh hopes to use AI to cure traffic congestion.]
When it comes to winners, however, Orlando has seen the most year-to-year improvement in vehicle time by far, shaving off an average of 30 seconds of drive time to just 10 minutes and 20 seconds. Although there are numerous ways to assess the rankings, in terms of simply American shortest commutes, Oklahoma City provides the quickest drive times at an average of just 8.4 minutes per 10km.
As convenient and helpful as all these rankings and estimators are, this data underscores just how important it is for global transportation to speed up its shift towards renewable energy sources and increase reliable public transit options to cut down on pollution and resource waste. It’s easier to get to work and back in a car in some cities in large part because they are designed to be extremely car-friendly. Both compact and sprawled cities can benefit from strengthening public transit infrastructures to accommodate local populations.
Check out the worst and best US cities below.
Worst American cities for commuting in a car (in time per 10 km distance)
- New York City—24min 30s
- Washington, DC—20min 40s
- San Francisco—20min 30s
- Boston—18min 40s
- Chicago—18min
- Baltimore—17min
- Seattle—15min 30s
- Philadelphia‚15min 20s
- Pittsburgh—14min 30s
- Miami—14min 30s
Best American cities for commuting in a car (in time per 10 km distance)
- Oklahoma City—8min 40s
- Knoxville—8min 40s
- San Diego—8min 40s
- Dayton—9 min
- Syracuse—9min 10s
- Detroit—9min 10s
- Albany—9min 10s
- Fresno—9min 10s
- Jacksonville—9min 20s
- Raleigh—9min 20s
