
The Doomsday glacier has been on everyone’s minds lately. And it should be. With estimates that by 2100, sea levels will rise by 10 feet due mostly to meltwater from it, there’s much to worry about. Because of the precarious location of this Florida-sized ice shelf, when it goes, it will set off a chain of melting events.
In the past few years, teams of researchers have been racing against time to study and understand the Thwaites Glacier—the formal name of the so-called Doomsday glacier—and have dispatched several tools to help them do so, including an auto-sub named Boaty McBoatFace.
Previous work has been focused around figuring out how the glacier is melting, and how it’s affecting the seawater ecology in its immediate environment. Now, a new study in Nature Geoscience is using machine learning to analyze the ways in which the ice shelf has fractured and reconsolidated over a span of six years. Led by scientists from University of Leeds and University of Bristol, this research employs an AI algorithm that looks at satellite imagery to monitor and model the ways the glacier has been changing, and mark where notable stress fractures have been occurring.
The artificial intelligence algorithm has an interesting backstory: According to a press release, this AI was adapted from an algorithm that was originally used to identify cells in microscope images.
[Related: We’re finally getting close-up, fearsome views of the doomsday glacier]
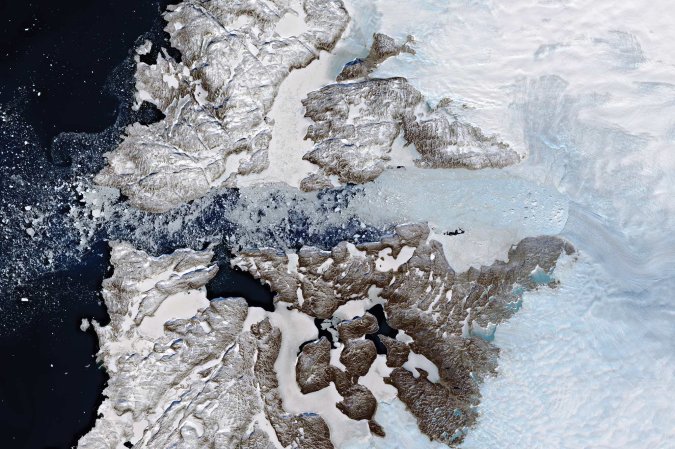
During the study, the team from Leeds and Bristol closed in on an area of the glacier where ”the ice flows into the sea and begins to float.” This is also the start of two ice shelves: the Thwaites Eastern ice shelf and the Thwaites Glacier ice tongue. “Despite being small in comparison to the size of the entire glacier, changes to these ice shelves could have wide-ranging implications for the whole glacier system and future sea-level rise,” the researchers explained in the press release.
Here’s where the AI comes in handy—it could take a more nuanced look at the satellite images of the glacier beneath the ice and snow. By doing so, it allowed scientists to perceive how different elements of the ice sheet have interacted with one another over the years. For example, in times when the ice flow is faster or slower than average, more fractures tend to form. And having more fractures in turn can alter the speed of ice flow. Moreover, using AI can allow them to quickly make sense of underlying patterns influencing glacier melting from the “deluge of satellite images” they receive each week. A more in-depth look at the model they developed for the study is available here.
In an area like Antarctica that humans have a hard time accessing, remote, automated technologies have become a vital way to keep an eye on events that could have impacts globally. Outside of diving robots and roving satellites, scientists are also using animal-watching drones, balloons, and more. Plus, there’s a plan to get more high-speed internet to Antarctica’s McMurdo Station to make the process of transmitting data to the outside world easier.
