
Earthquakes in California, hurricanes in Florida, blizzards in New York, tornadoes in Kansas—Mother Nature has many options for wreaking havoc everywhere in the U.S. A comprehensive risk estimate for every type of natural disaster can help insurance underwriters decide how much to charge for covering structures against damage. But creating one is an enormous endeavor. The world’s biggest risk analysis and management company, Risk Management Solutions, has been developing this catastrophe risk map—the most comprehensive of its kind—since the early 1990s. Insurance companies are less concerned about hazards that affect sparsely developed areas. So instead of just calculating where a disaster might strike, analysts compute the likelihood—and likely severity—of property damage at a given location. The result is a single scale that reveals the scope of vulnerability—and most of our big cities are at risk.


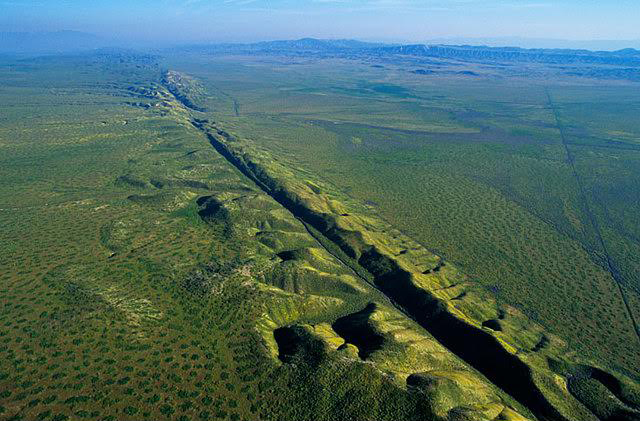
In the Bay Area and other earthquake zones, much of the risk comes from fire, which can break out after the shaking stops. But modeling the fire is complex: The resulting conflagration could cause more damage on a dry, windy day than on a rainy one.

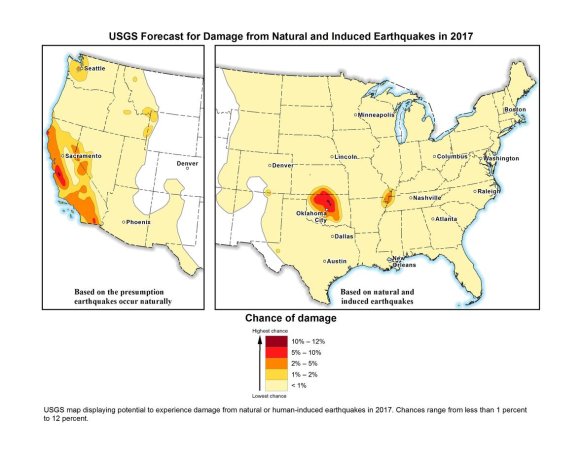
The New Madrid fault zone has seen earthquakes that rival California’s. In 1811 and 1812, the region had three quakes stronger than magnitude 7.4.

Much of Hawaii’s risk stems from volcanic activity, but indirectly so; the volcanic hotspot that created the island chain also triggers earthquakes.
Breakdown: The Six Individual Disaster Types
The overall risk map [above] includes six types of disasters, each with different severities. For example, the Northeast is most vulnerable to snowstorms, but the area is at low risk overall; blizzards are less savage than tornadoes.


