What is it?
This Wednesday, June 26, at approximately 10:27 p.m. (EDT), NASA will send a new solar explorer into orbit: the Interface Region Imaging Spectrograph (IRIS). [NASA just delayed the launch for 24 hours. Updated launch date: June 27.] IRIS joins an impressive fleet of NASA’s heliophysics missions, but is unique (for reasons that will be explained shortly). It will travel on a sun-synchronous, polar orbit – which, in plain language, essentially means that it is carefully calibrated to ensure continuous observations of the sun for eight months a year, at around 400 miles above Earth’s surface.
What is its mission?
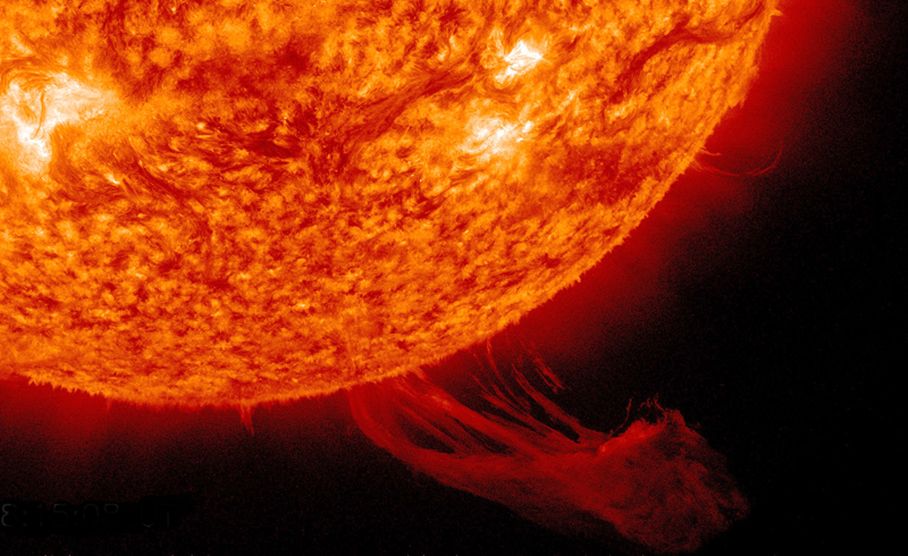
IRIS stands out from NASA’s other missions because it is the first satellite that is designed to continuously study the interface region. The interface region is a scientific puzzle: it makes up the region between the sun’s surface – around 6,000 K – and the sun’s corona (or upper atmosphere), which tends to fluctuate between 1,000,000 K and 2,000,000 K (though it can spike up to 10,000,000 K during solar storms). From the sun’s fusion core moving outward, the temperature steadily declines, as one would expect. Yet after breaching the surface, the temperature spikes again – dramatically. Scientists have some idea of what accounts for this discrepancy, and have had brief success with similar projects, but with IRIS, they hope to improve on the hypotheses by generating consistent and fine-tuned data.
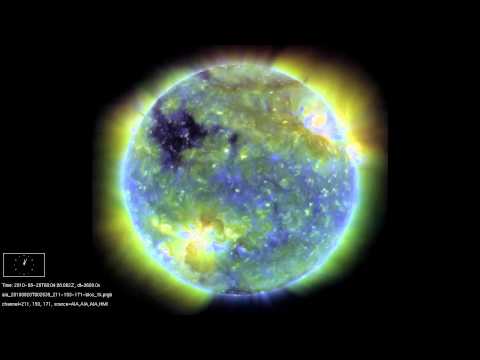
SDO 7 Month Time Lapse Movie, April 25 – November 30, 2010
A seven-month time-lapse of the sun
How will IRIS study the interface region?
IRIS is equipped with an ultraviolet telescope, designed to study the temperature range in between the surface and the corona, as well as an imaging spectrograph. Most ultraviolet light gets filtered out in the ozone layers, so Earth-based observatories are unable to study the spectra in question. IRIS, however, will provide the sharpest images of this region, and will relay them faster than ever before.

A typical IRIS reading will look something like the following: The telescope takes in about 1 percent of the sun’s light, “resolve[s] that image to show features on the sun as small as 150 miles across,” and then sends that information to the spectrograph. The spectrograph (as its name suggests) splits up the light information into a detailed wavelength graph, and then relays the information back to Earth. Bart De Pontieu, the project’s science lead, explains why: “By studying that light, we can understand how hot the gas is on the sun that we’re looking at, what kind of densities it has, and how fast it moves (away from us or towards us). The combination of those three things allows us to really understand what makes the plasma cool and heat and how the magnetic field of the sun drives these solar storms.” Back on Earth, the data will be plugged into NASA’s supercomputers, combined with data from other solar projects, and then used to generate complex, informative 3-D models of the region.

What else will we learn?
Aside from potentially learning the answer to the temperature discrepancy puzzle, IRIS still excites scientists. First, understanding our own solar system’s star will enhance our ability to forecast and predict solar storms, which, if severe enough, would wreak havoc on Earth. Also, scientists can use this data to better understand other stars in the universe.
For more information, explore the mission page.
