8 Stunning Science Visualizations
SHARE

Images are fundamental to science. Biologists use X-rays to study the fine structure of plants, and astronomers take pictures with the Chandra telescope to probe the dynamics inside of exploding stars. When it comes to places where no camera can look, scientists create images from the information available: geologists use seismic data to build charts, diagrams and simulations of the deep Earth churning.

As a nod to the importance of images in science–both those taken with cameras and those constructed from data–the National Science Foundation holds a competition every year for the best visualization in science. The entries never disappoint.

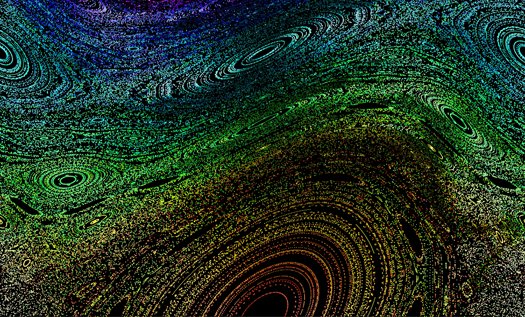
Take a look at some of our favorites from this year’s competition here, and then go vote for your favorite–today is the last day to vote!

NASA

TYCHO’S SUPERNOVA REMNANT

NASA’s space-based Chandra X-ray telescope recorded this image of the Tycho supernova remnant–an exploded white dwarf star located about 13,000 light years from Earth. Low-energy X-rays–shown here in red–illuminate smoke-like plumes of expanding debris; the higher-energy X-rays (in blue) show the blast wave from the explosion.
Origins of Chaos

Origins of Chaos

This image shows how a basic mechanical system can produce both order and chaos. The dots are actually points on a plot: each point shows the angle (x-axis) and speed (y-axis) of an imaginary rotor (like a helicopter blade spinning without friction or air resistance) at a single moment in time. This map is the result of 1,000 imaginary trials: during each one, the blade begins at a different angle and velocity, and its trajectory is mapped every second for 100 seconds. As the process repeats, the plotted points begin to form an image composed, in some areas, of highly regular patterns, and, in others, of scattered, randomly arranged dots.
plant seeds x-ray

SMALL SEEDS, BIG DETAIL

Physicists in the Czech Republic created these super-high-resolution X-ray images (left) of plant seeds using an ultra sensitive semiconductor detector capable of recording every photon that strikes it. Advances in detector technology are allowing scientists to investigate the structure of living tissues in virtually infinite detail. The images on the right show a microscope’s view of the same seeds.
X-ray of a lily

ELEGANT LILY

A professional photographer took an X-ray of a lily, then digitally enhanced the image to extract the flower’s delicate inner structure.
bouncing water droplet

WATER DROPLET SEQUENCE

A water droplet bounces on a hydrophobic surface.
plasma ribbon

PLASMA IN A BOTTLE

An ephemeral ribbon of plasma–created when high heat or strong electric fields rip electrons from molecules of gas–snakes toward the mouth of a glass bottle.
universe at different scales

VIEWS OF THE UNIVERSE

This illustration shows snapshots of the universe at several scales and distances, from a wide view of the oldest, most distant galaxies (top), all the way down to the iris of a human eye (bottom). The bright bands between snapshots represent galaxies and stars whose images have been across the page. and for a full image with labels.
monkey brain visualization

COMPUTER BRAIN

Engineers at IBM are finding inspiration in monkey brains for the next generation of computing. This visualization, based on a wiring diagram of a macaque monkey’s brain, is part of researchers’ efforts to figure out how to organize a brain-like network of computing cores. Each core is represented as an individual point along the ring. The cores are organized into 77 small clusters, similar to the 77 main regions of the macaque brain. The curved lines between nodes show the 300,000 connections between the cores.