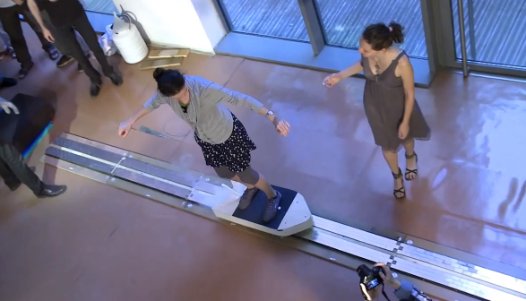
Winter FINCH II cruise aboard the R/V Oceanus, January 15 - February 4, 2005. Chief Scientist: Glen Gawarkiewicz. Science crew: Will Ostrom, Craig Marquette, Frank Bahr, Chris Linder, and Brian Kidd (U. Delaware). The primary objectives of the cruise were to set and retrieve short-term moorings and complete a hydrographic survey using both the University of Delaware Scanfish and the shipboard CTD.
SHARE

Scientists from every discipline have more data than ever, but it’s only as useful as the meaning behind it. Every bit of information is only explained by the context in which it was gathered, and often in the context in which it is used. “There is no such thing as raw data,” says Bill Anderson of the School of Information at the University of Texas at Austin and associate editor of the CODATA Data Science Journal.

Take the number 37, Anderson says. Other than stating a numerical order, it means little on its own. But with some more information — 37 degrees Celsius, for instance — it can take on more meaning. Now give it some context: 37 degrees C is normal body temperature. Now 37 represents something useful, something a doctor or researcher could use, and it becomes a piece of knowledge that could comfort a patient or answer a question.

Click to launch the photo gallery

A scientist may think he’s gathering data for one experiment, but increasingly, the records will be used by many more people than just his research team — it will be parsed and re-parsed, dumped into databases and models, and scrutinized by several different teams in different disciplines. Without proper context and record-keeping, it can be difficult for others to use data in new ways, but better data husbandry can help. That way, scientists can be assured their data is congruent and they’re comparing apples to apples, or normal body temperature to high temperature, as it were.

Data stewardship is important for everything from politics to climate change — which became clear again last week after another climate study examined 1.6 billion surface temperature records, and joined the chorus of scientists who agree the globe is warming. Click through to the photo gallery to see five projects seeking to keep better tabs on data.

Small mouse

Same Mouse or Different Mice?

Mouse One does not look like Mouse Two, and they have different names, but the gene map says they’re identical, or at least almost identical. How do you square this problem? It can even have policy implications — it’s important to determine whether one distinct-looking species is in fact genetically different than its cousins, because this can affect whether it is listed as threatened or endangered. Take this little guy, for example: The Preble’s meadow jumping mouse. Found in riverside habitats in eastern Wyoming and the Front Range of Colorado, the tiny rodent has been a flashpoint for almost 13 years, after the U.S. Fish and Wildlife Service designated it as threatened throughout its entire range. Ranchers, farmers and developers were not pleased, because maintaining its habitat is expensive and disruptive. Things came to a boil after several critics said the Preble’s mouse (named for the man who discovered it in 1899, Edward Preble) is not actually a distinct subspecies, but is genetically the same as other jumping mice found on the high plains. The FWS, however, maintains that is different enough to warrant protection. Its hind feet are specially adapted for jumping, and a long bi-colored tail. It has been listed and de-listed a few times under the Endangered Species Act, at one point inducing a multi-state dispute when it was considered threatened in Colorado but not in Wyoming. Just this August, the FWS reinstated protection requirements for both states. “The best commercial and scientific information available demonstrates that the Preble’s meadow jumping mouse is a valid subspecies and should not be removed from the list of threatened and endangered species based on taxonomic revision,” the FWS said. Who’s the final arbiter? This is still an ongoing debate, and it’s not limited to the Preble’s mouse. Birds, crocodiles and plants are among several subjects constantly subjected to revision and argument. To improve matters for plants, at least, the Missouri Botanical Garden and the Kew Royal Botanic Gardens in the UK compiled the Plant List, a collection of every species and all the ways they can be categorized. “Without accurate names, understanding and communication about global plant life would descend into inefficient chaos, costing vast sums of money and threatening lives in the case of plants used for food or medicine,” the project says. The first version was done in December 2010.
Machine near the sea

A Sea of Oceanography Data

Oceanography is by definition cross-disciplinary — researchers who study whales and dolphins also must understand their habitat, for example — so oceanographers are generally awash in data. The Woods Hole Oceanographic Institution is trying to make it easier to get that data from ship to shore and make it shareable and usable. WHOI and Rensselaer Polytechnic Institute’s Tetherless World Constellation project are developing an Ocean Informatics strategy, which includes building new ways to document and store data. A small working group has been interviewing scientists about what they need, with the goal of building a new data storage infrastructure, as well as determining how data collection can become better streamlined. “Individual scientists benefit from large-scale science collaborations in ways that were not originally envisioned,” as the working group puts it. The group is tasked with determining how to increase ” the ability for a single data set to be used by multiple researchers in different disciplines and sub-disciplines.” A full report is anticipated by the end of the year.
Crime map

Crime Data From All Over

Accurate criminal justice records are crucial for many reasons — they prevent criminals from buying firearms and working with children or the disabled, they help public officials make policy decisions, and they help employers conduct background checks, among other uses. To make sure databases are accurate and therefore useful, the federal government helps states keep better records. The Criminal Justice Data Improvement Program, through the Bureau of Justice Statistics, tries to help states and local governments improve their record stewardship. It has three sub-programs focusing on criminal history records, state justice statistics and the national instant criminal background check system. “Complete records require that data from all components of the criminal justice system, including law enforcement, prosecutors, courts, and corrections be integrated and linked,” the BJS explains. Crime stats are another area requiring careful use of context. The FBI’s Uniform Crime Reports organize crime data culled from each state, but each of them has different record-keeping methods and distinct laws, so the numbers can vary. And the reporting is voluntary (although most law enforcement agencies use it), so it paints an incomplete picture. For the UCR numbers, the FBI cautions that simple glances at the data can lead to simplistic or incomplete analysis.
Iceberg

A World of Climate Change Data

The IPCC Climate Change Data Distribution Centre maintains climate records for worldwide use, including data sets from varying research groups and climate change prediction models. Analysts collect data from these disparate models and convert it into compatible formats. This way, scientists in China and scientists at Berkeley can use the same data set without having to make any alterations or conversions, which will ensure their results are based on the same numbers. Climate modelers can use whatever data sets they want, but the IPCC hopes the availability of its data will encourage analysts to use it. The DDC maintains four types of data — actual climate observations, global climate models, socio-economic data and data for other environmental changes, other than warming records. The climate observations include monthly ground monitoring station data from 1961 to 1990, as well as temperature anomalies throughout the 20th century. This data set has come under fire in the past because some monitoring stations were considered ill-equipped or inaccurate; a recent study by a self-described climate skeptic used those stations, and tons of others, and found the data holds up and that the globe is warming. The DDC’s climate model data comes from climate modeling centers, which use several data points to predict how the climate will change over time. The socio-economic data is used to study emissions scenarios and resource use, which also drive the models. Finally, the “other environmental changes” section includes data on things like CO2 concentration, particles in the atmosphere, and sea-level rise.
Small call center

Even Political Data

If data is power, then the people who want to be in power should be immersed in all kinds of data. President Obama’s reelection campaign is no exception. Obama 2012 is taking predictive modeling and statistical analysis to new political heights, using metadata to zero in on issues of interest to voters and find new ways to connect with those voters. The campaign is mining sites like Facebook to collect demographic info, political views and location, reports data expert Micah Sifry, in a recent analysis for CNN. It is using an internal social network called NationalField to connect staffers to relevant data about the tasks at hand, like voter registrations and even thematic information like what voters want to discuss. “Obama’s campaign operatives are devising a new kind of social intelligence that will help drive campaign resources where they are most needed,” Sifry writes. With this method, voter data becomes much more than a name and a phone number to call for donations. By following Obama’s campaign on Facebook, voters voluntarily give the campaign a huge amount of context: gender, birthday, current city, religion and political views, not to mention the same information about all of their friends. This can help campaign operatives craft much more tailored messages. With NationalField, they can even use a color-coded system to gauge how these messages are resonating with voters. Republican campaigns are not immersed in this level of detail, he adds, which could be an advantage for the incumbent. But Election Day is still a year away, so the GOP has some time after the primaries to get on board the Big Data train.