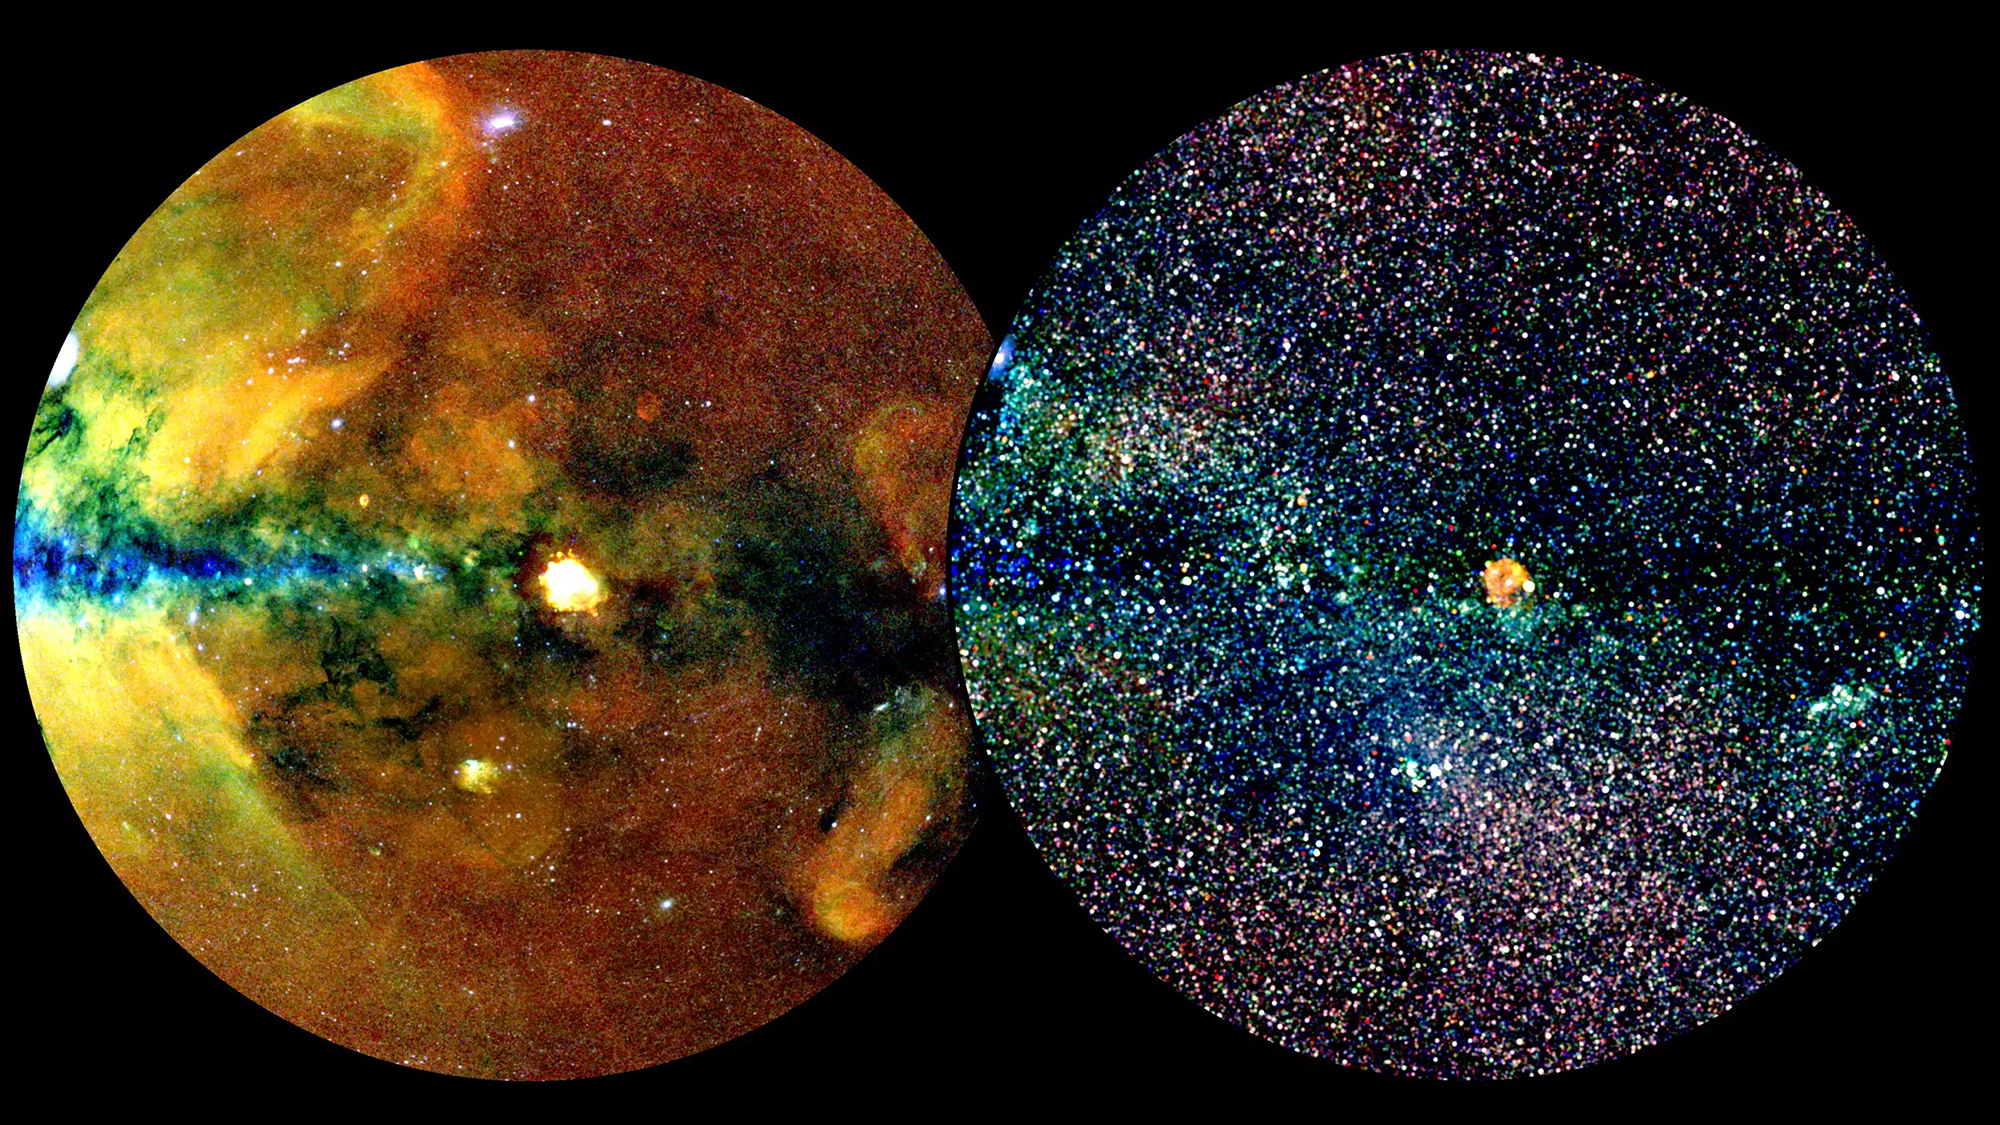
On February 1, a team of astronomers and cosmologists published the first data from the eROSITA sky survey. The data includes a cosmic map of half of the universe that was taken in X-ray light. Scientists from institutions in Germany and Russia used the eROSITA space telescope, which is positioned at Lagrange Point 2 near the James Webb Space Telescope. The soft X-ray imaging telescope generated a detailed X-ray view of the sky over the western hemisphere. The map includes close to one million cosmic sources of energy, including more than 700,000 supermassive black holes that are gobbling up the centers of galaxies.
[Related: What is matter? It’s not as basic as you’d think.]
This new survey called the eROSITA All-Sky Survey Catalogue (eRASS1) is the largest-ever catalog of the most powerful sources of energy in the universe. The data was gathered between December 12, 2019 and June 11, 2020. According to the team from the Max Planck Institute for Extraterrestrial Physics in Germany, eROSITA was able to capture 170 million individual particles of X-ray light called photons. By measuring the energy and arrival time of each photon, astronomers could build a detailed map of the cosmos. The team did so by processing and calibrating the photons detected by the telescope against both bright and diffuse backgrounds.
In addition to the over 900,000 X-ray sources and supermassive black holes, the map has about 180,000 X-ray-emitting stars in the Milky Way and 12,000 galaxy clusters. It includes some less common objects like pulsars, binary stars, and supernova remnants. The survey also features some cosmic web filaments. These bunches of hot gas are the largest known structures in the universe and connect galaxies in clusters.

“These are mind-blowing numbers for X-ray astronomy,” Andrea Merloni, eROSITA principal investigator and co-author of the first paper, said in a statement. “We’ve detected more sources in 6 months than the big flagship missions XMM-Newton and Chandra have done in nearly 25 years of operation.”
About 50 scientific papers accompany the data release, adding to the already 200 studies already written using the eROSITA telescope. The primary goal is for this telescope to use clusters of galaxies to observe how dark energy accelerates the expansion of the universe.
The treasure trove of data collected from eRASS1 could lead to answers to some of the biggest questions in cosmology, namely how the universe evolved and why space is expanding at a quickening pace. The data release also pinpoints the positions in the sky from which individual photons are received, when the photons arrive, and how much energy they contain. This helped make the map more precise.
The eROSITA Consortium made the software needed to analyze the data from the telescope and the catalogs that go beyond X-ray data available.
[Related: Dark energy fills the cosmos. But what is it?]
“We’ve made a huge effort to release high-quality data and software,” eROSITA Operations team leader Iriam Ramos-Ceja said in a statement. “We hope this will broaden the base of scientists worldwide working with high-energy data and help push the frontiers of X-ray astronomy.”
eROSITA made three other scans between June 2020 and February 2022, but the project was put on hold due to Russia’s invasion of Ukraine. Additional cosmology results based on an in-depth analysis of the cluster are expected to be published by the middle of February. A full list of the newly released scientific publications from this data can be found here.
