Before we started trying to figure out which big science projects are actually the biggest science projects in the world, we had to put down a few parameters. First, the projects had to be up and running, rather than be in the planning or construction phase. Second, we decided to disallow projects that were coming to the very end of their lifetimes, like the Tevatron, which will cease operations in September 2011. Finally, we decided that projects like the Svalbard Seed Vault (as cool as it is) didn’t qualify, as they aren’t primarily involved with producing new data.
That left us with about 20 candidates. We gathered stats on each of the 20 projects, including their annual budgets, estimated construction costs (we translated these into 2011 US dollars), staff size and physical size. We broke each of those categories into tiers of numerical ranges to make the calculation a bit easier.
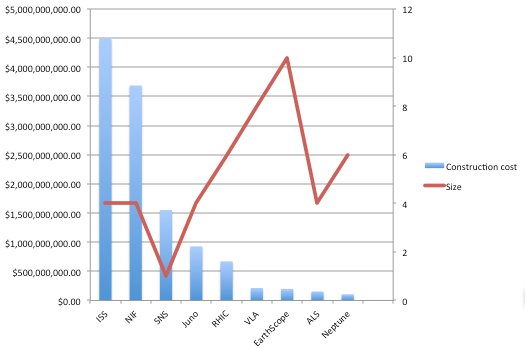
We wanted to make sure that we ended up with a clear 1-10 ranking, rather than have, for example, a three-way tie at #10. To avoid that situation, we had to make sure our ranges didn’t end up clumping the projects into a relatively few number of tiers. Take budgets: The large discrepancy between a small, relatively cheap project like Neptune ($12M a year) and a massive, costly undertaking like the ISS ($2B a year), necessitated that we look at the entire data set and figure out which projects were outliers. Otherwise, if we just split the spread into 10 equal portions, we’d get a bunch of projects in tier 1, 2 and 10, and none in the intervening tiers. We calculated the mean, standard deviation and z-scores for each data point in each category. A z-score tells you just how far from the mean a given data point is, indicating if a number is abnormally large or small, given all of the other numbers in a given data set. We took those with abnormally high (or low) z-scores out of the tier-spread calculation.
Once that was done, we put each project and its quantitative data into tiers. Those with high z-scores were automatically put into Tier 10, while low ones were put into Tier 1.
After dealing with the hard numbers associated with each project, the PopSci staff and researcher Brooke Borel next huddled in a freezing-cold conference room to discuss our “qualitative” (read: totally subjective) categories. We decided on three: Scientific Utility, What’s In It For You, and Wow Factor. Then we ranked all of the projects, on a scale of 1 to 10, in the three subjective categories. This yielded some interesting arguments, split pretty clearly between those who have science backgrounds and those who have journalism backgrounds. The staff biologist, chemist and physicist really dug projects that happened to have boring names, like the Spallation Neutron Source, because of their ultimate payoff to many branches of science, but the rest of the staff started making snoring noises when these projects came up(hence their low “wow factor” scores but high “scientific utility” scores). We all liked the Jupiter probe on a suicide mission, because crashing into the solar system’s largest planet is bad ass, but it ended up with a low WIIFY score because, let’s face it, none of us are going to be landing on Jupiter any time soon.
Lastly, we then voted on the weighting scheme for each of the seven categories, four objective and three qualitative. We weighted all three qualitative scores at 1, because we felt they were the most important to the average reader. Construction cost came in at 0.75, because big projects tend to cost a lot. Staff, physical size and annual budget came in at 0.5 apiece, to indicate that we didn’t think these factors were as important (or, in the case of annual budget, we didn’t want to give undue weight to money matters). After that was decided, it was merely a matter of running the calculation to get an overall score for each project.
