Recording A Century of Night Skies Through A Scanner Darkly
Harvard has a world-class trove of valuable astronomical data. But it's in the form of half a million glass photographic plates

CAMBRIDGE, Mass. — In the basement of a quaintly cramped building on the Harvard University campus, down a set of corkscrew stairs that would make a rollercoaster designer dizzy, the shelves and filing cabinets are spilling over with 100 years of stars. Glass photographic plates shipped from telescopes around the world document the Beehive Cluster as it appeared in 1890, or Cepheid variable stars as they looked in 1908. The glass plates — some 525,000 of them — serve as the only permanent record of the skies as seen by our forebears.
But the 170-ton database represents much more than an archive of astronomical history — it’s a potential gold mine for new discoveries, if only scientists could dig through it. With that goal in mind, a small collection of astronomers and archivists is using custom-built technology to bring this enormous data set into the digital age.
Click to launch the photo gallery
When they’re finished in three or four years, the archive will consume 1.5 petabytes of storage. Any astronomer with web access can click on a star catalog and pull up an individual star’s light curve, showing how it has brightened or dimmed over time.
“We don’t have 100 years of data in any other form that is as complete as this,” says Josh Grindlay, a Harvard astronomer who leads the project, formally called Digital Access to a Sky Century @ Harvard. “There’s a real treasure trove of results here, and we’ve just been scratching the surface.”
As of Nov. 1, researchers had scanned 18,812 plates, a little more than three percent of the collection. But they are already bearing fruit, as Grindlay’s own research shows. He just submitted a paper to the Astrophysical Journal describing a potentially major finding: The mass-accretion formation of a Type Ia supernova. It’s a finding that brings Harvard’s astrophotography legacy to an almost touchingly complete full circle, if you’re into astronomical history. In 1912, Harvard astronomer Henrietta Swan Leavitt used photographic plates to discover Cepheid variable stars, the first “standard candles” used in cosmological measurements. A century later, another astronomer using the same images has re-discovered the second-generation cosmic yardstick, Type Ia supernovae, which just facilitated a Nobel Prize.
“It indicates that there is all sorts of incredible stuff lurking in 100 years of data,” Grindlay says.
Along with enabling new science, the project has been a lesson in how modern technology can preserve the past. Scanning humanity’s oldest sky photographs requires the most advanced imaging technology Harvard postdocs and engineers can assemble.
WHAT IS A PHOTOGRAPHIC PLATE?
To understand what the Harvard team is doing, it helps to have some background in astrophotography. Until the invention of the charge-coupled device (which won a Nobel Prize of its own), astronomers mostly used plate glass slides to take their pictures of the sky. The plates were commonly 8×10 inches or 14×17 inches, and coated on one side with a light-sensitive silver gel emulsion. Using a cloak to protect the emulsion, astronomers would slip the glass into a tailpiece on the end of the telescope and expose it to starlight. The exposures were later developed with mercury vapor or other chemicals, and then shipped back to Cambridge for further study.

Plate Insertion
Digitizing these plates is a lot like scanning photographic negatives — you just illuminate the negative and take a picture. Back in 2005, some engineers and volunteers from the Amateur Telescope Makers of Boston designed a high-speed scanner to do this. The digitized images would then be matched to star catalogs and used to extract light curve data for every star on every plate. The device had to scan one 14×17-inch plate or two 8×10-inch plates at a time, it had to be ultra-high resolution, it had to be kept cool and completely still to prevent blurring — and oh, it all had to fit through a couple tiny basement windows.
The digitizer, which was installed piece-by-piece, moves over the plates with linear servo motors and is guided with laser-etched markings. It sits on a granite slab which is itself protected by pneumatic legs to prevent any vibration interference coming from the antique building above it. An LED light source illuminates the plate emulsion in 8-microsecond bursts, and a CCD camera captures 60 overlapping images for each 8×10 plate. The final resolution is 11 microns per pixel, or 2,309 dpi — captured in 92 seconds. Put another way, in a minute and a half, the machine generates about the same amount of data as contained on a DVD for a typical hour-and-a-half movie.
In 90 seconds, Harvard’s plate scanner generates about the same amount of data as contained on a 90-minute DVD.
The worst part? Before this process can start, the plates all have to be cleaned first and then loaded manually, a painstaking task that occupies much of Alison Doane’s time these days.
The plates are sort of a living library, and just like an old book, they’ve received their fair share of annotations during the past century. Astronomers would write on the glass side (not the emulsion side) to note what they were working on, Doane explains.
“There are very often handwritten notations, indicating a star, a brightness, a position, or circling a discovery,” she says. “We have to remove all of that, which is a big undertaking. It’s not something that we enjoy doing, but if we don’t do it, we’re going to see twice as many stars as are actually there on the plate.” After documenting the scribbles, she and a small staff of workers and students remove them by hand, using Windex and razor blades.
This will all get easier after Doane receives a custom-built automatic plate washer, which is being built with a grant from the National Science Foundation. It will work somewhat like a car wash undercarriage, driving a plate along a conveyor with the glass side facing down and the emulsion protected. The current prototype employs two types of brushes, but Doane says she and designer Bob Simcoe, who also oversaw the scanner development, are considering adding a razor too.
Grindlay hopes the washer, and an added staff member who started work in October, will help the project get up to full speed by January. He hopes to scan between 200 and 300 plates per day, ultimately ramping up to 400 per day. At that rate, they’ll be done in about four years.

Telescope in Peru, 1897
DIGITIZING HARVARD’S LEGACY
The plate collection, like Harvard College Observatory itself, looms large in the history of astrophotography. In July 1850, daguerrotype photographer John Adams Whipple captured the first-ever picture of a star, Vega, using the observatory’s mahogany-and-brass Great Refractor. By the late 1880s, observatory director Edward Charles Pickering had endeavored to photograph the entire sky, collecting photographs from the northern and southern hemispheres. The college shipped a 24-inch telescope to Arequipa, Peru, in 1896, and followed with telescopes in South Africa and other locations. During the next three decades, astronomers slipped glass plates into the observing tubes of their telescopes, making exposures of the entire sky, and then gathered them and shipped them back to Cambridge.
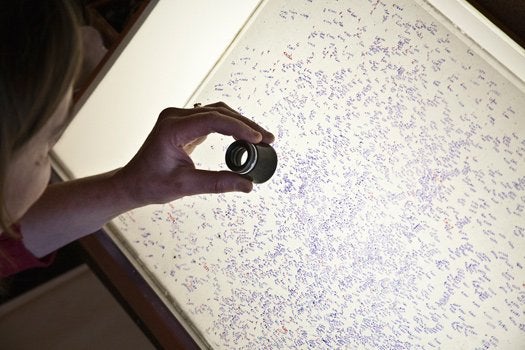
There they would be examined by “computers,” women recruited by Pickering because they were good at math, who scrutinized the plates through magnifying loupes and calculated stars’ brightness levels by studying their diameters. Leavitt, one of the more talented computers, discovered Cepheid variables in the Large Magellanic Clouds, which became crucial for determining astronomical distances. Without Leavitt’s discovery, Edwin Hubble could not have discovered the expanding universe.
“It’s such an old-fashioned way to do science,” Doane says. “Younger scientists, even middle-aged ones, don’t know how to look at the plates. They don’t have the developed skill to look at something that is the size of a point, and see that has changed in size by a very small amount to understand that it’s getting brighter.”
Modern computers are doing the work automatically, calculating stellar magnitude once the plates have been scanned. Grindlay used this data to make his Type Ia discovery, he says. He noted a 14th magnitude star (a very dim star, several orders of magnitude dimmer than the faintest stars you can see with the naked eye) that quickly brightened to 12th magnitude (two orders brighter, but still relatively dim). This brightening happened in an unusual manner, with a rapid increase and slow decay over a decade’s time, Grindlay says. Astronomers checked it against star catalogs and determined it was an M giant, a big red star, in a binary system. So why did it produce this bright flash? A white dwarf is orbiting the red giant, accreting mass from its larger companion, Grindlay explains. The mass accretion ignited thermonuclear burning on the surface of the smaller star. And this happens to be how Type Ia supernovae are born.
“This is something that we astrophysicists have been looking for, for years,” Grindlay says. “What we think we have found, thanks to 100 years of data, and one star doing this amazing thing, is a very likely long-sought mechanism for how you add mass to a white dwarf.”
Other astronomers are using heritage plates for different types of new science. Elizabeth Griffin, an astronomer at the Herzberg Institute of Astrophysics in Victoria, Canada, has been dusting off near-ultraviolet negatives from 1905 up to the 1980s to study the ozone layer. She examines spectral lines, in which starlight is split up into its constituent parts so astronomers could determine the star’s composition. The atmosphere imprints its own signature on the negatives, and in some cases it interferes directly with astronomical measurements. Ozone, for instance, gets in the way of the element beryllium, which can be studied to determine a star’s age.
“[For several decades], people had hardly heard of ozone. They thought it was an awful nuisance,” says Griffin. Astronomers determined the ozone layer’s spectral signature and learned how to filter it out; now Griffin is looking for that signal and ignoring the rest, trying to determine how the ozone layer’s thickness changes over time. “I did learn that ozone is very variable from night to night and place to place,” she says. “It was a novel application for heritage data.”
Still, the Harvard collection is much larger, and is the only collection to represent both hemispheres of the sky. It will help astronomers in several fields — perhaps even astronomers using the Kepler Space Telescope, for whom light-curve information is especially crucial. Grindlay says the so-called Kepler field, an area between Vega and the northern cross in Cygnus, is almost done being scanned. Laurance Doyle, an astrophysicist with the SETI Institute who used Kepler data to find the first circumbinary planet, said light curves can teach researchers plenty about stellar history. “There’s almost an endless amount of stuff you can do with a light curve. Just using a light curve, you can detect circumbinary planets three ways,” he says. “The time realm has been under-explored in astronomy.”
Who knows what else is in those slides, just waiting to be found.

Inspecting Scribbles and Stars

Pulling Out the Plates

Archive

Photographed

Cabinets

Cleaning

Removing Marks

Collection

Final Inspection

Lightbox

Scanner

Programming the Scanner and Archive

Detail

The Realm of the Nebulae

Daguerreotype

Signs

Stacks and Stacks of Plates