By Neel Dhanesha
By Sara Chodosh
By Murray Dick/MIT Press Reader
By Jessica Boddy
By Eleanor Cummins
By Matthew Phelan
By Jake Bittle
By Kaitlin Sullivan
By Kate Baggaley
By Kendra Pierre-Louis
By Rachel Feltman
By Popular Science Team
By Claire Maldarelli
By Peter Hess
By Kelsey D. Atherton
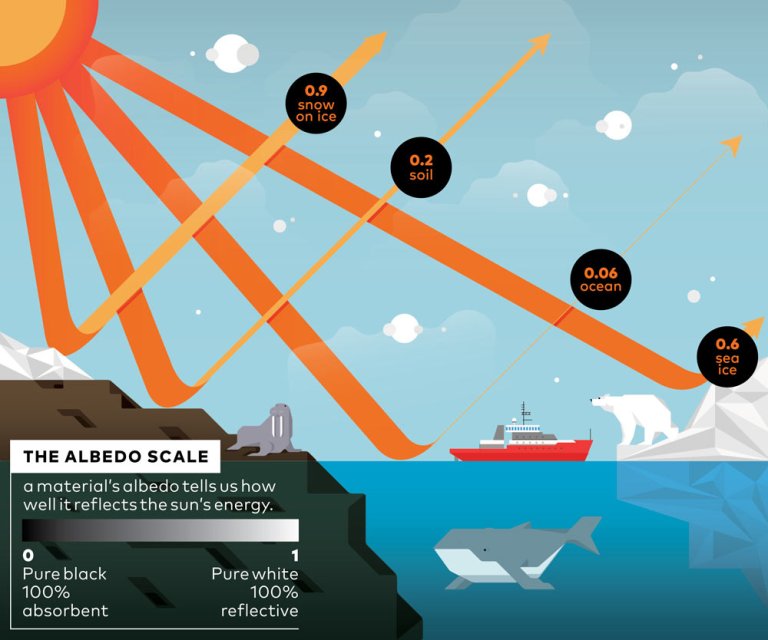
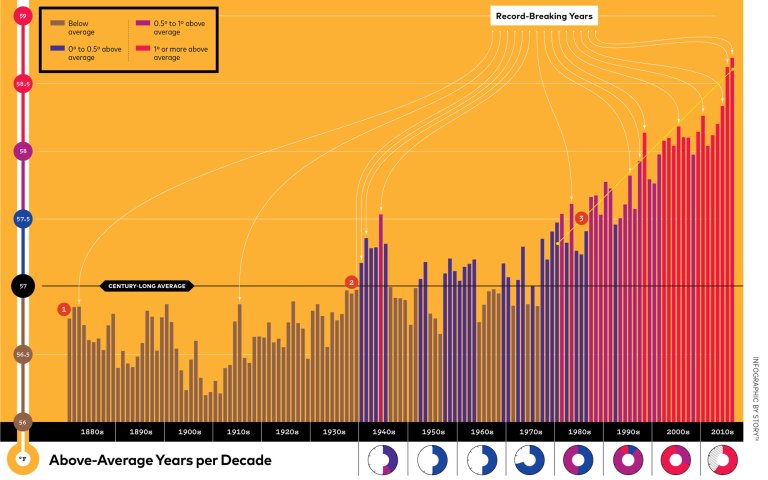
By Katie Peek
Get the Popular Science daily newsletter💡
Breakthroughs, discoveries, and DIY tips sent six days a week.
Terms of Service and Privacy Policy.