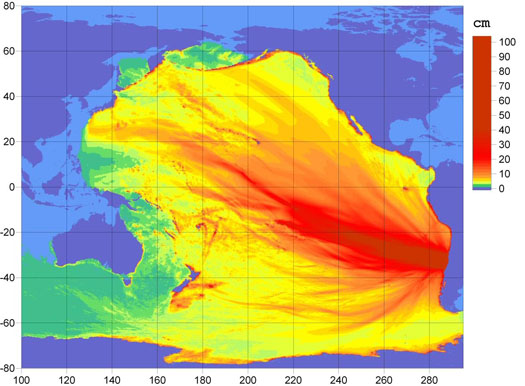
It’s easy to think of tsunamis as phenomenon that mimic the behavior of ripples on the surface of water; you toss a stone into a pond and the resulting energy from the splash moves out away from the epicenter in a series of even, concentric circles. But this NOAA energy distribution map from the 8.8 magnitude earthquake in Chile over the weekend tells a different story.
Though the tsunami threat wasn’t great – the reddest portions of the above map represent only 3-foot-plus waves – you can really see the way the energy pushed out away from the continental shelf, posing the same threat to islands in the mid-Pacific and all the way across the ocean in Asia as it did to nearby coastal regions along South America’s northern Pacific coast (though the immediate coastal areas near the epicenter did experience some deadly waves, with the sea coming as far as two miles inland in places).
Three-foot surges were reported in places as far away as California and small waves hit shores in Hawaii and then Japan, though damage in those places was minimal. It’s a reminder just how powerful and far-reaching the natural processes of our blue planet can be.
