This is how much of the world is currently on fire
The 2017 fire season is a global phenomenon.
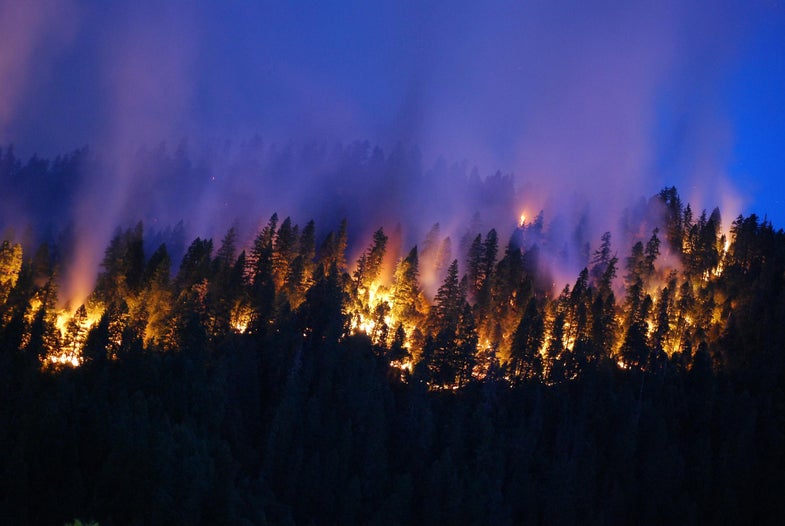
You may have missed the memo (we get it, there’s been a lot going on) but the world is currently on fire. Massive blazes burn in the United States, Canada, Russia, South America, and across Europe. To give you a sense of the scale of the inferno, we’ve included maps of the wildfires, as well as images from some of the fiery scenes. Here is the lowdown.
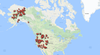
United States
Here in the United States the Forest Service is reporting that 2017 is shaping up to be a worse than average fire year based on acres of federal, private and state land burned. So far, 5.6 million acres of land has burned this year, or 1.8 million acres more than the ten year average of 3.8 million acres burned by this time. Some states like Nevada are saying that 2017 is the worst fire season in 15 years, while Montana has already used up much of its firefighting budget, even as much of the state remains in drought conditions according to the US Drought Monitor. The state may have to tap into reserve and federal funding, but that isn’t the only cost. Brent M. Witham, a 29-year-old firefighter from Mentone, California, was killed cutting down a tree while working on the Lolo Peak Fire.
Despite urgent conditions, funding for the nation’s six Regional Climate Centers (RCCs) which provide data that we use to help control and prevent wildfires is on the chopping block. The President’s proposed budget would slash the Centers’ budgets by 82%, from $3.65 million to $650,000.
The Centers were originally developed in the 1980s with bipartisan support because of the service and expertise they provide as data collectors, analyzers and subject matter experts. If they’re eliminated, “We would lose a lot of fundamental climate services,” Tim Brown, Research Professor Climatology Director Western Regional Climate Center told Popular Science. “That includes information for decision makers for drought, fires and floods, and impacts, on transportation and human health, water supplies, energy and disaster management planning, all of these areas the regional climate center program supports.”
On a more concrete level this includes banal information, such as yesterday’s temperature high and low—that’s Regional Climate Center Data. More critically, if we’re talking fires, this also means the loss of Western Based US Drought Monitoring Author which adds to the weekly drought map that government uses to allocate drought relief as well as an early drought warning system—i.e. the conditions which can precede wildfires.
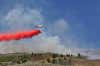
Canada
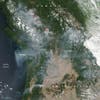
Across the border from the United States, fires are also currently scorching Canada’s British Columbia. This is the province’s second worst fire season on record and NASA satellites have identified the conflagration from space. It’s unsurprising that the smoke is billowing over the border into nearby Seattle in Washington state which for much of last week was also under a heat advisory. On Thursday, the city hit a record breaking 94 degrees at the Seattle Tacoma airport. The regular high for the region at this time of year is 77 degrees. Between the heat and the fact that the region has been, according to US Drought Monitor is unnaturally dry that wildfires are knocking on their door is unsurprising.
1 AM and it's 77 degrees in Seattle. That's our normal daily high temperature for this time of year. #wawx
— NWS Seattle (@NWSSeattle) August 3, 2017
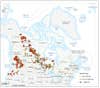
Europe
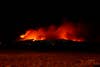
On the other side of the globe, if you load up the European Commission’s fire map, it looks like the end of the world, especially in Italy and Romania. So far, an area just slightly smaller than the state of Rhode Island has burned. The total is already roughly three times the normal amount of summer wildfires. Back in June, 60 people died over the course of one weekend in Portugal due to wildfires. Thirty people were killed when the fires reached roads on evacuation routes. And as the map makes clear, those fires don’t seem to be abating, in part because of the hotter, drier temperatures.
Europeans have dubbed the heatwave “Lucifer”—a nod to the devil whose hell is supposed to be a high temperature inferno. The name seems to suggest that they may already be living through hell.
According to European news reports, researchers are saying that climate change is to blame, as warmer temperatures have extended the regions fire season, potentially making weather like this increasingly the region’s new normal.
Earlier this spring, Ireland, an island perhaps most synonymous with dampness battled fires primed, in part, by 75-percent less rainfall.
 to use the interactive version.](https://www.popsci.com/uploads/2019/01/07/4KFK5C5HLORCD7RWUQZPS64IFI-1024x524.png?auto=webp&optimize=high&width=100)
Worldwide Infernos
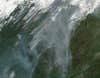
Wildfires are also plaguing Siberia in Russia, an image NASA has managed to capture on satellite footage, along with large swathes of Brazil. Back in June, South Africa was ablaze, and in New Zealand in February (during their summer) the city of Christchurch called a state of emergency after a wildfire sent thousands running from their homes and destroyed homes, and killed a pilot. In January, Chile, for whom like New Zealand January is summer, battled a similar unusual number of wildfires due to a combination of drought and high temperatures.
An increased number of wildfires is one of the scenarios predicted under climate change. Warmer temperatures lead to more evaporation and drier soils—perfect conditions for wildfires. Especially out West, warmer temperatures mean that snow melt happens earlier (if it builds up at all) which means soils are drier for longer—extending fire season. At the same time, an indirect climate change threat in the form of an increase in tree killing insects have left behind a lot of dead plant matter for fires to feed on. So now when a fire breaks out, say, after a lightning strike, the conditions are such that it can burn hotter and spread further. Similarly, the introduction of invasive species in the United States, most notably cheat grass, has also given actual fuel to the fire. Cheat grass seeds in the fall, grows through the winter, and by June it’s lifecycle is more or less done, leaving behind a dry woody plant that is perfect forest fire fodder. Perhaps most critically, the plant doesn’t mind fire, so after fires sweep through a region it is one of the first to reseed itself, leaving behind a landscape that is even more likely to burn.
While forest management practices in the past, especially those which called for immediately suppressing any fire are now seen as part of the problem, this still doesn’t explain the rise in wildfires in places where forests were not directly managed.
In the United States, some of the fires will continue to blaze until at least October, based on data in the Incident Information System.
Note: This story was originally published on August 5th but has been updated to include some ongoing images and to provide additional context.