Runner Data-Logs Her Jogs To Draw Pictures On A Map
One of our 15 favorite recent data visualizations
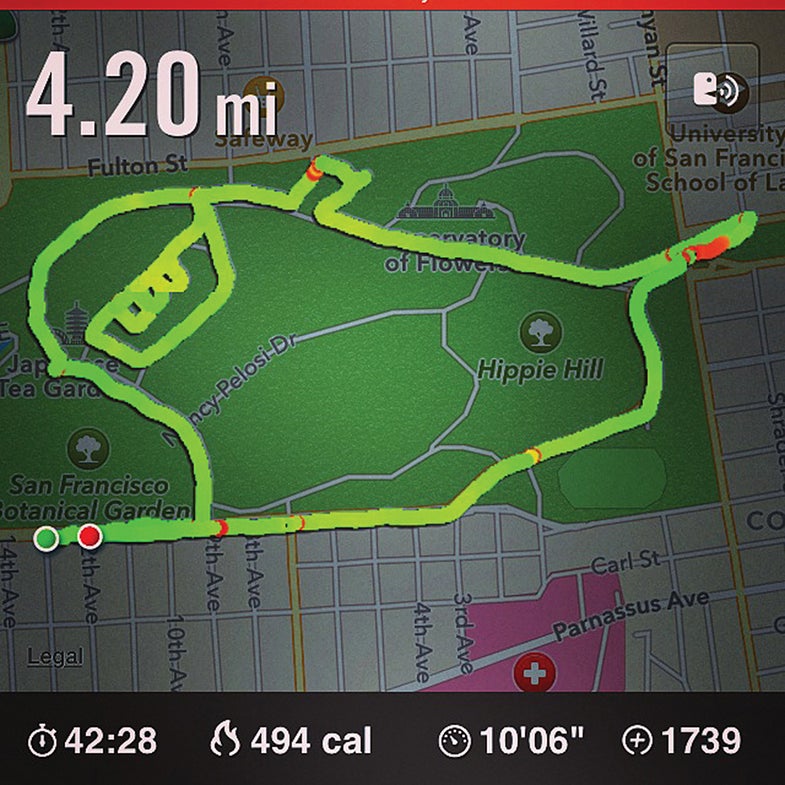
Visualizations don’t all have to be serious. They can be lighthearted—and a little subversive. Claire Wyckoff [NSFW] uses the Nike+ run-tracking tool as a data-illustration canvas: She turns it on, then goes for a run in the shape of an (often lewd) image. This outing, from July, traced Slimer from Ghostbusters through a San Francisco park.
See all 15 of our favorite recent data visualizations here.
This article was originally published in the November 2014 issue of Popular Science, under the title, “Dawn of the Data Age.”