Here’s how we were able to see that giant chunk of ice break off of Antarctica
A golden age of Earth observation.
As big as the state of Delaware. Twice as big as Luxemburg. As heavy as 20 million Titanics.
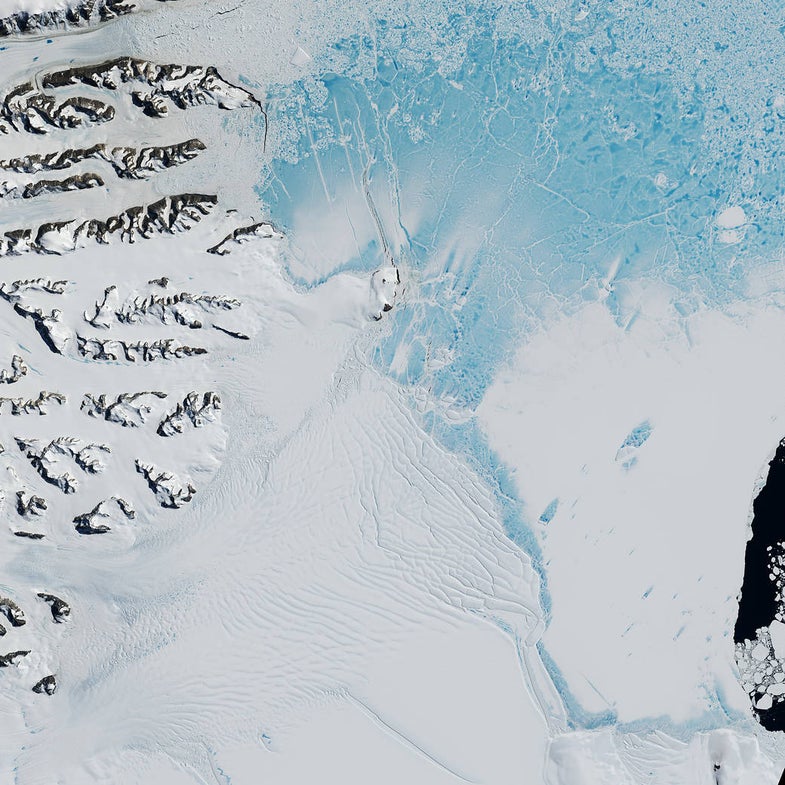
When Larsen C, a Western Antarctic ice shelf—otherwise known as a floating mass of ice attached to land—finally separated itself from the mother shelf earlier this week, the news didn’t just send waves rippling across the Wendell Sea. It also launched a thousand size analogies (it’s twice the volume of Lake Erie, in case you were still having a hard time visualizing it).
The sheer scale of the Larsen C calving, which is one of the largest iceberg breakaways ever recorded, drew much attention. So much so that the sheer awesomeness of the fact that we were able to track its movements in near real time was overlooked by many. Larsen C calved on the night between July 11 and 12 and by the morning the whole world knew about it—thanks to some incredible satellite imagery.
“We are living through an explosion in the availability of these kinds of satellites and these kinds of symptoms and data,” says Adrian Luckman, a glaciologist at the University of Swansea and a team member on the U.K Antarctic research project Midas. Project Midas looks at the impact of melt on ice shelf stability. “It’s not just the number of satellites that are now up there, but the policy of the various space agencies of making that data freely available, particularly NASA who have led the way in this.”
With all the stunning images we constantly receive from distant corners of Earth and space, it’s easy to forget that this ability is still a relatively new thing for humanity. A little over a century ago, the Titanic sank because the ship literally couldn’t avoid colliding with an iceberg. Whoops. Back then, keeping an eye out for giant hunks of ice meant posting lookouts on the ship’s deck to keep watch. These days, thanks to a network of Earth observing satellites, we can observe the birth of an iceberg from almost anywhere in the world.
Daniella Jansen, now of the Alfred Wegener Institute in Germany, first spotted the Larsen C rift back in 2014 while poring over Landsat data for Project MIDAS. Landsat are a series of Earth observing satellites developed by NASA and the United States Geological Services (USGS), best known to most of us for collecting most of the data used to populate Google Earth.
“The rift that caused this iceberg to calve is one of several rifts that entered the ice shelf from the south,” says Luckman. “There’s a dozen or so of these rifts, and normally they’re halted by a particular band of ice that’s a little bit softer than the rest. That has prevented any of the other rifts from entering a part of the ice shelf where they may cause a calving event.”
To understand the what, how, and why scientists are interested in Larsen C’s calving, look to the nature of ice shelves: these are the outer most edges of an ice sheet or glacier, formed as it slowly oozes downward and out to the sea. Ice shelves float on water, so their transformation from landlubbing hangers-on into free-floating icebergs doesn’t contribute to rising sea levels. But their presence acts as a kind of protective layer for glaciers, separating the ice mass on land from warmer sea waters.
“Ice shelves in general have a tendency to be in places where they act as a sort of cork or buttressing feature,” says Robert Hawley, an Associate Professor of Earth Sciences at Dartmouth University. “Glaciers from land flow into the ice shelf, but the ice shelf holds them back and kind of keeps them in check.”
An ice sheet becomes an iceberg when it separates from land and becomes free floating, something which happens frequently in Antarctica. But Larsen C attracted particular attention because it was one of the largest iceberg breakaways ever recorded, the process seemed to progress especially quickly, and we were able to watch that process unfold.
“It’s not only that they’re making this data freer,” says Luckman, “or that there’s a greater number of satellite resources available. They’re also all trying their hardest to make the information available in near real time—within hours of acquisition. That itself is a remarkable improvement in our ability to monitor the world.”
It was late last year—after NASA reported that the crack had grown to an estimated 70 miles long, more than 300 feet wide and about a third of a mile deep—that Larsen C truly stepped into the spotlight. NASA spotted the growing crack during its annual Operation IceBridge Antarctic survey. These aerial surveys of the polar regions serve to replace data lost when NASA’s Ice, Cloud, and Land Elevation Satellite (ICESat) stopped recording information back in 2009 (in 2018, a new ICESat satellite will step up to replace it). IceBridge is known for taking some awfully pretty pictures, but its true objective is to precisely measure the thickness of polar ice.
Polar ice data, in particular, is important not just because ice is cool, but because it provides insight into the Earth. The waters around Antarctica plays a crucial role in ocean currents, for example, but one that isn’t well understood. And the speed with which the ice sheets are melting, both in the Arctic and the Antarctic, gives us insight into climate change and sea level rise.
IceBridge was (and IceSat2 will be) equipped with a radar altimeter, which is also how European Space Agency’s (ESA) IceSat equivalent, Cryosat-2, works. Radar altimeters measure elevation by sending out radio waves and then measuring how long it takes for the beam to bounce back. Pictures might not show us a glacier is melting until it’s pretty far gone, but radar altimeters aren’t so easily snowed.
“Two antennas listen for the echo like a pair of ears,” says Hawley “The same way we can tell where a sound comes from by the small difference in time when it reaches one ear or another, we can do the same thing with the radar by listening what time it reaches one antenna versus the other, so we can determine from what direction the echo came.”
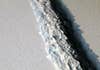
Unlike other forms of satellite detection, radar altimeters aren’t dependent on light, and aren’t impeded by cloud cover. That allows the satellites to get pretty precise data that can be used to both get detailed elevation data and create a rough picture of the scene. Here’s one the ESA made using Cryosat-2 data, illustrating the size and dimension of Larsen-C before it broke off.

Two satellites, NASA’s MODIS and ESA’s Copernicus Sentinel-1, captured the final split. The Sentinel-1 satellite works in the microwave spectrum, beaming microwaves down to the surface and collecting the reflections to create high resolution images—even if the weather is terrible, or the Antarctic winter has plunged the glacier into darkness.
“It is able to do that night and day irrespective of cloud cover, because microwaves go through the clouds,” says Luckman. “And it’s able to do that through the polar nights—that’s what was key to monitoring it in such detail.”
Senitinel-1 allowed researchers to keep an eye on Larsen C, but it did have a drawback. Sentinel-1 is an active satellite, which means it’s sending a signal to a region and waiting for it to bounce back—but it can’t do that everywhere simultaneously.
“Sentinel 1 was only programmed to acquire images every few days from this area, because obviously there has to be a budget of the space agency and how much they can collect from any one area,” says Luckman. “They were already focusing a lot of their resources on the Antarctic peninsula.”
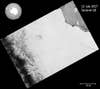
Because they knew that the calving was eminent, researchers started looking for alternatives. They identified MODIS as the most viable. MODIS, which stands for Moderate Resolution Imaging Spectroradiometer, is a thermal sensor that’s actually aboard two satellites—Aqua and Terra—working in tandem with each other. The easiest way to envision MODIS is as a camera without a shutter. It’s constantly capturing images as the satellites orbit the Earth.
Because MODIS uses thermal sensing, which relies on emissions from the surface, it can work in the dark of an Antarctic winter. And MODIS captures a full picture of the planet every day or two, which means some aspect of the calving would likely be recorded. But MODIS had its downsides as well—the resolution isn’t as great as Sentinel, and clouds can block its view.
Luckily for us, the weather on Wednesday evening was clear. And Sentinel happened to be beaming microwaves over the Antarctic at the time—but MODIS happened to provide the first image.

In recent years, there’s been an uptick in the number of both Arctic and Antarctic ice shelf collapses. Glaciologists think that the recent rate of collapse might linked to climate change, because while collapses are common, the ice normally recovers—it gets bigger. That hasn’t been happening; West Antarctica has been shrinking. But for now, it’s unclear whether Larsen C’s breakaway is another bellwether of a climate gone amuck, the result of natural processes, or some complex mix of the two.
And Hawley worries that we’re missing the bigger picture—that we should be keeping an eye on what happens now that Larsen C has broken off.
“When the Larsen B ice shelf disintegrated, the glaciers that fed into the ice shelf sped up afterwards and have remained at a higher speed,” says Hawley. “In spite of the fact that the ice shelf itself doesn’t contribute to sea level rise, the loss of the ice shelf as a buttressing effect does indirectly result in sea level rise because of these accelerated glaciers.”
Larsen C, now dubbed iceberg A68, will be tracked for a while. Its size makes it a risk if it should meander into shipping lanes. And it’s already broken up into two, still rather large pieces.
As long as we have access to the satellites that helped us watch A68’s calving, we’ll be able to keep that watchful eye.
“Much of the knowledge that we have from Antarctica and from the Arctic, almost all of the information, is from satellites,” says Luckman.
Correction, 7/17: A previous version of this article compared Larsen C to 20 Titanics, when in fact the iceberg weighed as much as 20 million Titanics. This particularly massive error has been corrected.