In Ancient Ice, Clues That Scientists Are Underestimating Future Sea Levels
The cold, hard facts
The skies do strange things at the NEEM camp, a remote ice-drilling and research facility on the northern Greenland ice sheet. Midnight sunshine. Low clouds of sparkling ice crystals known as “diamond dust.” But when rain fell instead of snow last summer, complete with a rainbow arcing over the camp, the NEEM scientists couldn’t believe it. “I’ve been all over that ice sheet, and to have it rain that far north—that’s a shock,” says James White, a paleoclimatologist at the University of Colorado who led the American team working alongside those from 13 other countries at NEEM.
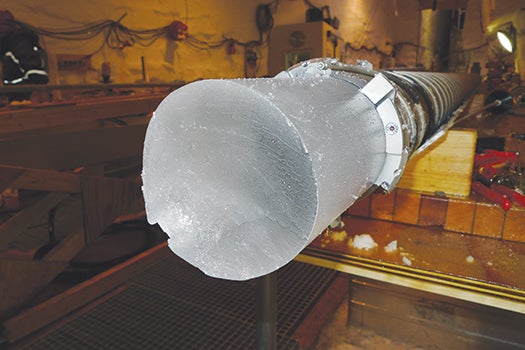
It’s fitting that part of the NEEM study’s fieldwork, which retrieved a two-and-a-half-kilometer shaft of ice, took place during one of the hottest Greenland summers on record. What that ice core has revealed about a warm period 130,000 years ago could be one of the most critical new tools for predicting how our planet will respond to a warmer future.
The NEEM ice core has provided the first picture of the Greenland ice sheet during the entire Eemian interglacial period, a 15,000-year span of natural warming that occurred between the two most recent ice ages. (NEEM is a rough acronym for North Greenland Eemian ice drilling.) During the Eemian, natural variations in Earth’s orbit brought the planet closer to the sun, making global mean temperatures up to 2°C warmer than right before the industrial revolution (the Arctic regions were made even warmer, between 3-5°C). That makes the Eemian an especially attractive period for scientists to study, because 2°C of global warming matches the temperature ceiling the UN and other international organizations have established as the limit of tolerable warming during the next century (a limit many climatologists believe we’ll meet or even exceed by the end of this century). And what scientists are learning about the Eemian period could be cause for present-day concern.
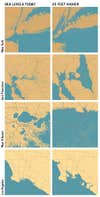
What scientists are learning about the Eemian period could be cause for present-day concern.Based on the study of the paleoclimate record in ice cores as well as the former locations of beaches and coral reefs, researchers believe that the Eemian temperature increase likely pushed global sea levels as high as eight meters (26 feet) above where they are today. That would put many coastal cities deep under water including Miami, the Los Angeles metropolitan area, and large parts of New York [see graphic]. During the Eemian, the polar ice sheets melted over several thousand years; an abrupt increase within the next century—seen by many scientists as inevitable, despite international goals—will not result in a 26-foot rise right away. “Even if you stabilize temperature by 2100, sea levels will keep rising for many centuries after that,” says Gavin Schmidt, a NASA climate modeler at the Goddard Institute for Space Studies who specializes in paleoclimate data. The ice sheets will take hundreds of years to fully react to warmer ocean temperatures, he says, “And there won’t be very much you can do about it.”

Dorthe Dahl-Jensen
The ice core pulled from the NEEM site has discrete, often visible rings, like a tree trunk—each season’s snowfall creates a new layer of fresh ice. By studying the chemical makeup of the layers, the NEEM scientists learned both the atmospheric temperature and the ice sheet’s height over the years. This data yielded a significant discovery: Previous models had assumed that the Greenland ice sheet was at least half gone at the Eemian’s hottest point, but the ice core showed that the sheet’s total volume decreased just 25 percent. That meltwater would account for only about two meters of global sea rise, according to Dorthe Dahl-Jensen, a paleoclimate researcher at the University of Copenhagen who led the NEEM project. Therefore, the remaining six meters of water had to come mostly from Earth’s other major sea-level “co-conspirator,” as James White likes to call it: the Antarctic ice sheet. This new finding suggests that West Antarctic ice is capable of melting far more than previously thought.
An accurate understanding of what was ice at what point in time is a key tool for testing computer models that forecast when, where, and how ice sheets will melt in the future. As data on ancient climates becomes more reliable, scientists can use that data to check their models and improve them.
Soaked Cities
Just five years ago, such ice-sheet modeling was a “cottage industry,” says Schmidt—improvisational at best, inaccurate at worst. In 2007, when the U.N. Intergovernmental Panel on Climate Change (IPCC) released its fourth and most recent assessment report (which guides climate science and policy for the years to come), it projected that sea levels would rise anywhere between 18 and 59 centimeters by 2100—a range that many scientists saw as a poor estimate based on inadequate data. The report inspired paleoclimatologists who study ancient climates and physicists who build climate models to start to collaborate closely, according to Schmidt. “The last report kind of punting on the whole sea level thing has been the driver of an enormous amount of effort in ice-sheet modeling,” says Schmidt. “It really was time to step up their game.”
Unfortunately, a clearer picture of the future is not necessarily a brighter one. In September, the IPCC will release the science portion of its fifth and latest report, and its sea-level projections for the coming century are expected to increase, based in part on new models of how ice sheets melt. In a field that predicts the future, a little hard data from the past can go a long way.

A Rainbow in Greenland