What the president can teach us about reading hurricane forecasts
It takes a whole team of experts to make those squiggly cones.
As hurricane Dorian battered the Bahamas before moving on to drench the coast of the Carolinas this week, President Trump frustrated and bewildered meteorologists by spreading inaccurate and out-of-date information.
After suggesting in a tweet on Sunday that Dorian posed a serious threat to Alabama, a statement at odds with National Hurricane Center (NHC) predictions at the time, the president has since doubled (and tripled) down on his claim with a trio of charts. One highlighted an array of old, raw data. Another featured a bespoke hurricane cone apparently hand-drawn in sharpie. And the third showed a low possibility of elevated wind speeds. While Trump’s assertions about Dorian’s Alabama-bound trajectory weren’t impossible (little is completely off the table when it comes to beasts as intricate as hurricanes), they appear to reveal a flawed understanding of NHC data products, whose subtle blend of historical records, physical forecasts, and human intuition represent the best the field has to offer.
“I’m certainly not going to go up against the hurricane center forecasters,” says Phil Klotzbach, an atmospheric scientist who researches hurricanes at Colorado State University. “That’s what they do every single day.”
On Sunday morning Trump warned in a tweet that Dorian would hit Florida, the Carolinas, Georgia, and Alabama harder than expected. At the time of his tweet, the NHC’s most recent projection had the storm swinging up along the east coast, avoiding the Gulf of Mexico. His tweet prompted a swift correction from the National Weather Service in Birmingham, Alabama.
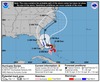
After criticism of his inaccurate statement, Trump stood his ground on Wednesday, explaining that his claim had been based on earlier models, ignoring the fact that more accurate forecasts had been available at the time. He tweeted a map from the previous Wednesday showing a dizzying array of possible hurricane trajectories, a handful of which did touch parts of Alabama.
This was the originally projected path of the Hurricane in its early stages. As you can see, almost all models predicted it to go through Florida also hitting Georgia and Alabama. I accept the Fake News apologies! pic.twitter.com/0uCT0Qvyo6
— Donald J. Trump (@realDonaldTrump) September 4, 2019
This type of graphic gathers together a bunch of squiggles known collectively and deliciously as “spaghetti models,” but interpreting this raw data calls for some expertise. Each strand marks a possible hurricane path, and each strand is calculated in a different way. The XTRP extrapolation line, for instance, assumes the hurricane will keep going the same way forever—a naive prospect for even the simplest of storms. “It’s not really a forecast,” Klotzbach says.
Another strand, the CLP5 line, traces out where hurricanes in the same location have gone in the past, ignoring all other details of the current storm. Meteorologists sometimes use this as a benchmark to measure how well a real model performs, according to Klotzbach.
Ultimately no individual line on this graph means much. What matters is how tightly they’re grouped—in this case, it’s worth noting that almost all the spaghetti strands initially clump together over the Bahamas. That’s a useful prediction, despite the raw nature of the information. But then the lines split apart, with some bending as far as Alabama or even Texas. This spread reflects how much uncertainty exists in a forecast made several days in advance, but doesn’t indicate any particular risk to areas on single strands of spaghetti.
The weighty responsibility of deciding which states to warn falls to a dozen or so experts at the NHC. They mix together assorted computer models and add a dash of human judgement based on years of experience. They consider how a particular model has been performing that season, and how it’s performed with similar storms in the past. They also fold in information about the weather—particularly after specialized balloons start sending back pressure readings from around an incoming hurricane. “Each storm is different. Some models stink with particular storms,” Klotzbach says. “That’s why we have forecasters and not just an automated procedure.”
That eventually leads to the familiar map known as the “cone of uncertainty,” a slug-like shape with a narrow tail and a fat head representing the zone that could—but won’t necessarily—be affected by the storm. The cone widens for the same reason that the spaghetti strands spread out, because uncertainty rises the farther in advance one tries to forecast a storm. The hurricane could end up passing over any of the places inside the cone, and may even spill over to affect places on the outside.
But while the spaghetti spreading expresses uncertainty for a specific storm looking forward, the cone’s widening represents uncertainty in hindsight. The middle of the cone marks the NHC’s best guess as to where the hurricane’s center will go, and its width represents how much the NHC’s best guesses have fallen short over the last five years. In theory, the hurricane’s eye should have about a two in three chance of staying between the cone’s sides at any given time, as measured by past forecast performance. Klotzbach notes that the three-day width of the cone has gotten twice as narrow over the last two decades, reflecting increasingly accurate forecasting.
Someone in the White House appears to think they can pull off a similar calculation on the fly, because in a Wednesday update from the Oval Office, a cone of uncertainty graphic attributed to the National Oceanic at Atmospheric Administration (NOAA) had sprouted a second head. The additional cone, which touched southern Alabama, appeared to have been sketched in with black ink. The President later denied knowing who drew the line.
On Thursday afternoon Trump changed tactics, turning to a seven-day-old NOAA winds chart saying that southern Alabama would have a five to 20% chance of receiving at least one minute of winds blowing harder than 39 miles per hour. The Beaufort wind scale describes 39 to 46 mile per hour winds as a “fresh gale” capable of breaking twigs off trees.
No one denies that as of last week at least a few simulations had Dorian nicking the corner of Alabama. When it comes to what matters, however—warning the people who may find themselves in harm’s way—hurricane researchers recommend sticking to official NHC announcements. “Basically,” Klotzbach says, “you need to mention the states that the Hurricane Center is talking about and not just do your own speculation as to where a storm might go.”
