The Prettiest Visualization Of Social Media Chatter We’ve Ever Seen
Much prettier than a Twitter timeline.
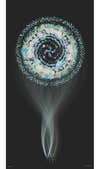
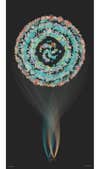
To commemorate the launch of 4G services in the UK, artist Brendan Dawes was commissioned to create these beautiful “digital portraits” of 11 cities. Really they’re more like “social media user portraits,” since that was the data used, though it’s not totally clear which social media that entails. What we do know is that Dawes tracked the biggest news stories over three days in October 2012, then graphed them in these gorgeous flower shapes. He explains the project over at his site:
Based on the same mathematics that create the head of a Sunflower, time explodes outwards from the centre with each point representing one minute giving a possible 4320 points – the number of minutes in three days – to cover the day before, during and after the launch of 4G.
The three days worth of data was searched for various keywords that were hot talking points at the time, including Skyfall, Hurricane Sandy, money, together with localised subjects for each city.
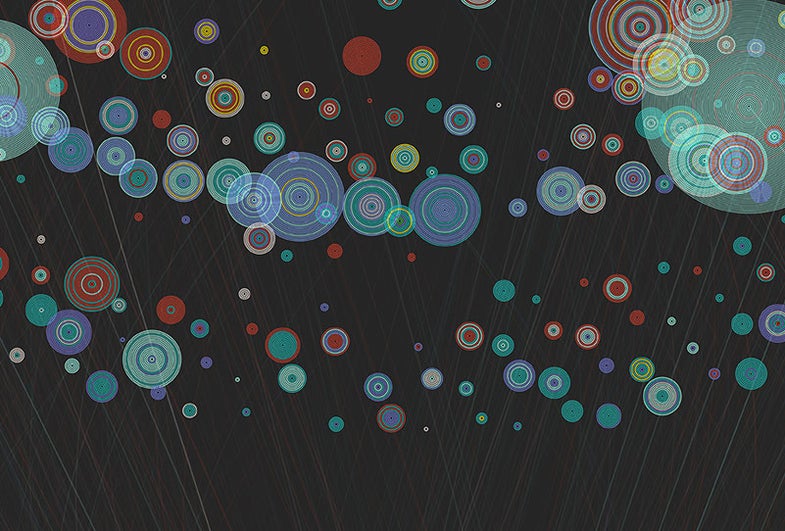
The subjects–“Romney,” “Skyfall,” “4G”–are color-coded, and each circle at top represents a minute. The more mentions a subject got every minute, the larger the circle. Other cities, you can see, follow a similar pattern, but are shaped slightly differently.
Which doesn’t answer everything: Do the position of the circles mean anything? Are the lines all connected to the circles? Which stories are the “biggest”? It’s more than a little confusing. Still pretty, though.
London Digital Map
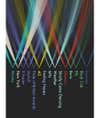
London Digital Map Key
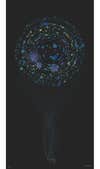
Leeds Digital Map
Southampton Digital Map
Check out more over at Dawes’s site.