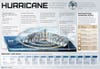
How Hurricanes Work [Infographic]
A visualized look inside a storm. How they start, and the ways we measure how bad they get.
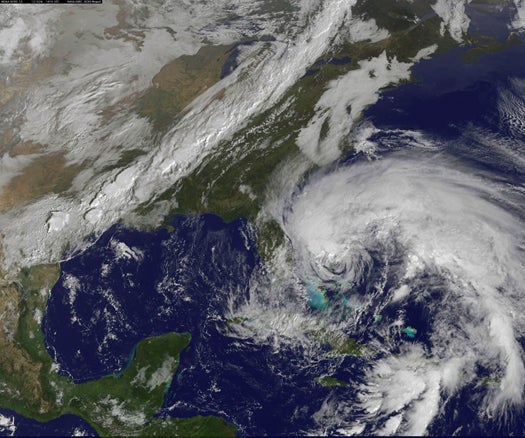
Anatomy Of A Hurricane
With Hurricane Sandy hurtling toward the East Coast today, here’s a handy infographic giving you the basics (and a little more) of how a storm gets going, and how to measure its scale. If you’re wondering what makes Sandy a Category 1 storm, here’s your answer: Winds between 120 and 150 kilometers per hour, according to the Saffir-Simpson Hurricane Scale.
There’s even a couple interesting historical tidbits. For example: Did you know the name hurricane comes from an American Indian deity? Or that a British Admiral invented a wind-speed scale in the early 19th century?
Click to see the infographic in full.
[Rianovosti via Vizworld]