3-D Laser Maps Show How Major Quakes Rend the Earth
Using lasers to map the Earth following an earthquake could reveal exactly where the planet’s crust ruptured, augmenting other seismological...
Using lasers to map the Earth following an earthquake could reveal exactly where the planet’s crust ruptured, augmenting other seismological networks that document the destruction. With detailed maps, experts could potentially judge where the Earth might split — not necessarily predicting earthquakes, but pinpointing their likely locations and preparing for the worst hazards associated with them.
In a new study, scientists from the U.S., Mexico and China made the most comprehensive before-and-after topographic picture of an earthquake zone, the April 4, 2010 7.2-magnitude El Mayor–Cucapah earthquake in Mexico. That quake tore a 74-mile rupture through multiple faults in northern Baja California. By comparing existing LIDAR maps of the area with new flyovers, the researchers could see the where the Earth moved, and by how much. They even spotted new faults that had not been documented before.
High-resolution light detection and ranging, LIDAR, enables super-precise topographical measurements. In this case, it just so happened that the Mexican government mapped the El Mayor region with LIDAR back in 2006, so there was a recent topographical model to work from. After the 2010 quake, researchers from Arizona State University, who knew about that original map, applied for funds to go map the area again.
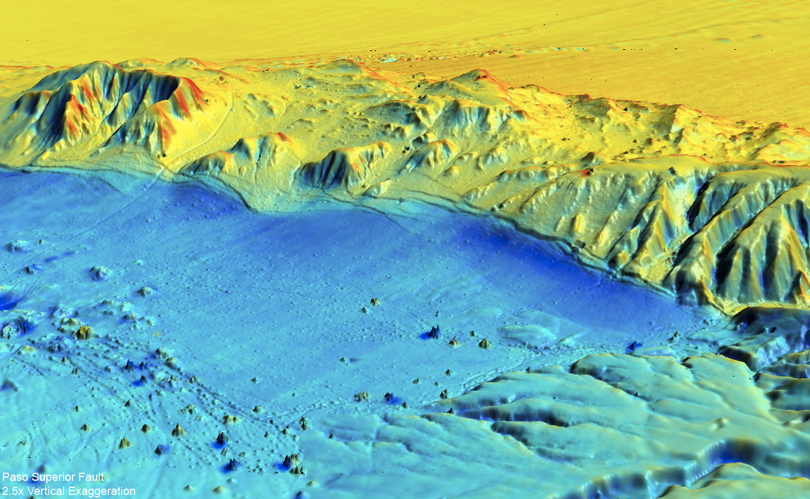
Ground teams surveyed the area first, narrowing it down, and then the team made a 140-square-mile LIDAR scan over a three-day period, according to a news release from the University of California-Davis, where some of the other researchers were based. Some of the effects were obvious, including a shocking five-foot-high scarp that sheared away from a hill. But others were far more subtle, and only visible with this type of high-resolution altimetry. The scans revealed new fault lines and ground warping, including a very subtle but important wrinkle in an agricultural plain, as seen in the picture below. The scans helped explain how several small faults came together on that day to form the powerful earthquake.
Geophysicists have been using LIDAR for about a decade, but there are only a couple projects to make pre-earthquake LIDAR maps. Back in 2009, NASA started flying a modified Gulfstream III with a synthetic aperture radar system to map faults in southern California. Detailed topographical maps from these scans could help pinpoint stress along fault lines — and help seismologists determine where the worst damage could occur, before and after the fact.
The Mexican earthquake research was published today in the journal Science.
Subtle Fault Lines