


 Space
Space
 Life Hacks


Environment

Animals


Deals & More
- The best soft coolers for chilling out in 2024
- The best Klipsch speakers in 2024
- Save $100 on the Sony ZV-E10 camera kit (its cheapest price ever) and start your career as an influencer
- The best cannabis essentials for 2024, tested and reviewed
- Best Budget Bluetooth Speakers
- The best coffee machines for offices in 2024
- The best turntable accessories for Record Store Day 2024
- The best portable blenders in 2024
- Get Greenworks battery-powered lawnmowers and tools for their cheapest prices ever at Amazon
- The best gaming laptops under $1,000 in 2024
- The best seat cushions for office chairs in 2024, tested and reviewed
- Save $90 on a DEWALT drill and bit driver set at Amazon
- The best microscopes for students in 2024
- Swing over to Amazon for 20% off a PlayStation 5 console
- QLED vs OLED
- The best floor lamps in 2024
- Save up to $1,200 when you pre-order Samsung’s Bespoke AI appliances
- Stock up on protein shakes and powders from Dymatize and Premier for 30% off at Amazon right now
- The best ergonomic keyboards of 2024, tested and reviewed
- How to make a pinhole camera to watch the solar eclipse
- If you buy a 2024 Samsung TV, you get another 65-inch 4K TV completely free while they last
- The best electric commuter bikes for 2024
- The best closet organizers for 2024
- Get a KitchenAid stand mixer for just $250 at Amazon
- The best wired headphones for 2024, tested and reviewed
- The best countertop microwaves in 2024, tested and reviewed
- Save 50% or more off of just about everything during Patagonia’s wild annual sale
- Samsung 2024 TV and soundbar lineup: First impressions
- The best shredders for small offices in 2024
- Take half off this TikTok-famous collapsible storage bin at Amazon and kickstart your spring cleaning
- The best smart grills for 2024
- The best toasters for 2024, tested and reviewed
- Breaking through the noise
- Breville makes our favorite smart ovens and they’re all 20% off at Amazon right now
- Amazon’s largest Kindle is at its lowest price since Black Friday
- The best camping gadgets in 2024
- Save almost 50% on this ECOFLOW solar generator bundle at Amazon
- How to dye Easter eggs, volcano-style: An explosion of color with a splash of science
- The best air purifiers for 2024
- Whip up Easter savings with$80 off a KitchenAid mixer at Amazon—but act fast
- The best LED light bulbs for 2024
- Score a Solo Stove fire pit or pizza oven for a historic low price during Amazon’s Big Spring Sale
- The best 32-inch TVs for small apartments, dorms, and bedrooms in 2024
- Save hundreds on solar generators during Amazon’s Big Spring Sale
- Snag Simple Modern’s insulated tumblers and drinkware for their lowest prices ever at Amazon
- Amazon’s Big Spring Sale drops Anker Soundcare headphones and earbuds below Black Friday prices
- Best Mixing Headphones
- Best Mattress
- Best Cooler Bag
- The Apple MacBook Air M1 laptop is just $650 at Best Buy right now while supplies last
Latest
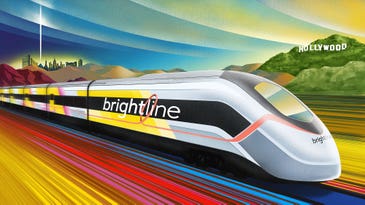
US finally breaks ground on its first-ever high-speed rail
The rail could connect Los Angeles and Las Vegas by the end of the decade.
The world’s first successful limb re-attachment is a fascinating story of science and human ingenuity
A team of doctors did something in real life that had only ever existed in mythology and science fiction.

Read the last letters by George Mallory, who died exploring Mt. Everest in 1924
'Darling I wish you the best I can.'

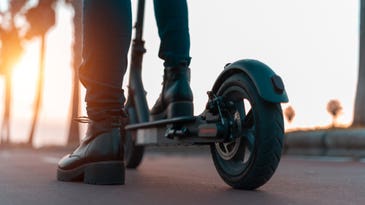
8 years into America’s e-scooter experiment, what have we learned?
The climate benefits of shared e-scooters depend upon how companies deploy and manage them, and what steps are taken to keep riders safe.
Should you take vitamin D? Here’s the science
Some people take too much, and too many get too little. Experts explain who needs D supplements, and why.

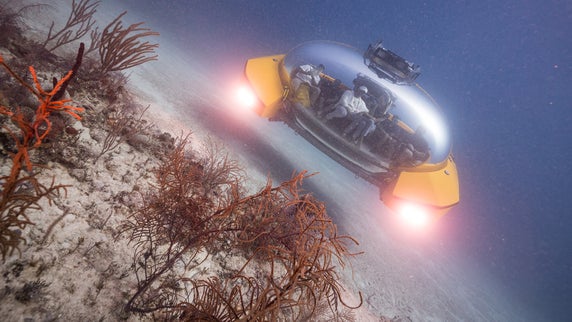
The algorithmic ocean: How AI is revolutionizing marine conservation
Driven by a childhood marked by war and environmental devastation, Dyhia Belhabib developed an innovative technology to combat illegal fishing.

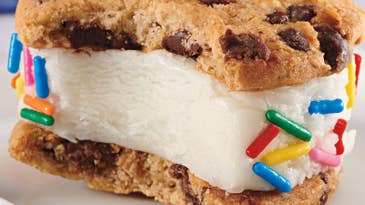
Amazon has a bulk snack sale going on just in time for 4/20
Save on Red Bull, Barilla pasta, Animal Crackers, Perfect Bars, Kodiak Cakes, and more. This is a solid chance to stock up.
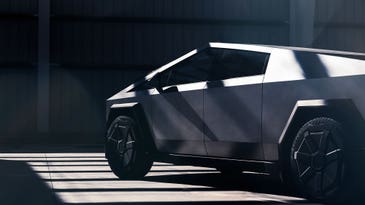
Nearly all Cybertrucks recalled over faulty accelerator pedal, misapplied soap
Elon Musks says, 'We are just being very cautious.'
Staggering quantities of energy transition metals are winding up in the garbage bin
Recycling more of the copper, aluminum, and other minerals in our old electronics could reduce the need for mining.