How Filthy Is Your Neighborhood? This Map Can Tell You
New EPA map is looking for environmental justice
Do you know how many tiny particles are in the air you breathe? What about the amount of lead paint in your neighborhood? Or if you live close to a toxic dump site? Now, a new online tool can help you find answers.
The Environmental Protection Agency (EPA) announced today the creation of EJSCREEN a mapping and screening tool that looks at any U.S. location’s environmental indicators, like pollution, and compares them to that location’s demographics. The EJ in EJSCREEN stands for Environmental Justice, a movement that seeks to stand up for communities disproportionately bearing the burden of environmental issues like pollution. Usually these communities are poor, and inhabited mostly by people of color.
EJSCREEN is designed to allow activists and community organizers to easily compare environmental hazards (proximity to traffic, ozone in the air, proximity to toxic sites, lead paint levels) with demographic factors (How many people living here have low incomes? How many are minorities? How many are very young or very old?)
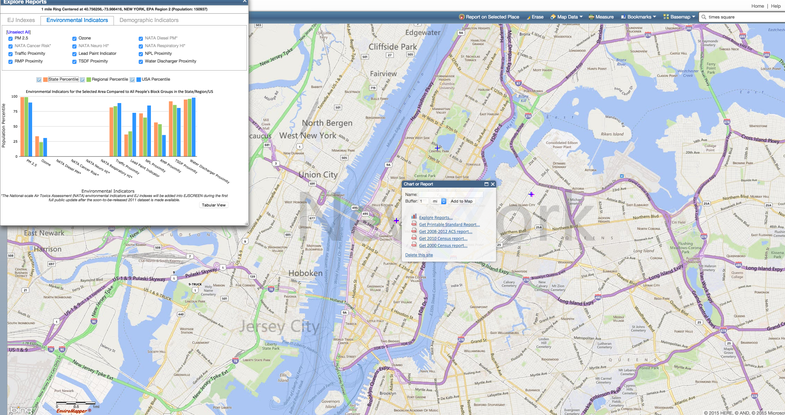
The mapping tool (which you can find here) is easy to use. Type in your address, or select an area that you’re interested in, then click on the button that says ‘report on a selected place’, and a graph will pop up showing you exactly how your community ranks compared to the United States, your state or your region. The EPA even has a detailed description of how to interpret your results.
“EJSCREEN provides essential information to anyone seeking greater visibility and awareness about the impacts of pollution in American communities,” EPA Administrator Gina McCarthy said in a statement. “EJSCREEN has been a valuable resource for EPA to advance our commitment to protect Americans most vulnerable to pollution. I’m excited to share this tool with the public to broaden its impact, build transparency, and foster collaboration with partners working to achieve environmental justice.”
This tool is just a test run. The EPA is looking for feedback, and plans to release a revised version next year, which will include additional data.