Digital Map Of Seafloor Could Help Scientists Predict Climate Change Impacts
The secrets are in the sediment
As more data is beamed back from the New Horizons Pluto flyby we are constantly learning more about the surface of a dwarf planet billions of miles away, while mysteries on our own planet lay waiting to be uncovered within the ocean’s depths.
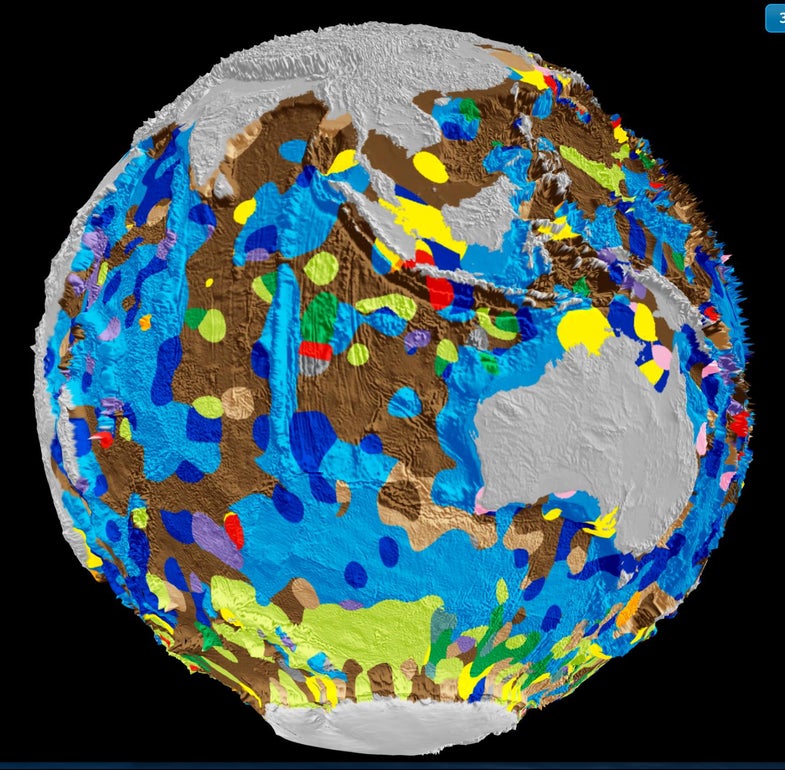
A recent study published in Geology describes the first ever comprehensive digital map of our seafloor’s sediment composition, which covers 70 percent of the planet’s surface. The interactive map will not only lead to a better understanding of the ocean floor, but may help predict how the ocean’s environment will respond to climate change.
Researchers at the University of Sydney based the data of their seafloor map on around 14,500 marine sediment samples collected from research cruise ships traveling around the world from as early as the 1950’s. Thirteen major classes of marine sediment such as silt, clay, and diatom ooze are marked by a different color—making the map look as if it was pulled directly from an elementary school mural. This map provides a missing link between the changes that occur on the sea surface and those on the seafloor. The patterns of where these different sediments are located can inform researchers not only about past environmental activity but allow them to better predict future environmental changes as well.
“The deep ocean floor is a graveyard with much of it made up of the remains of microscopic sea creatures called phytoplankton,” said lead author of the study, Adriana Dutkiewicz, in a press release. “The composition of these remains can help decipher how oceans have responded in the past to climate change.”
There are other detailed maps, which have used satellite data to visualize the topography of the ocean’s floor, as well as other projects like GeoMapApp, which pools together multibeam bathymetric data to also create a digital map of the ocean floor’s topography, including physical oceanography and seabed composition. However, Dutkiewicz’s new seafloor map is the first digital map based on nearly half a century of sediment data. Many past seafloor sediment maps have changed very little since a hand-drawn map made in the 1970’s, according to the study, and the ocean floor is far more complex than had previously been thought.
This new map shows that there is 30 percent more calcareous sediment and clay in the world’s ocean floor. It also shows that the dead remains of a special group of phytoplankton called diatoms, which produce a quarter of the oxygen we breathe, accumulate on the seafloor almost completely independent of diatom blooms, where the phytoplankton population booms and busts because of favorable conditions. Many of the newly discovered changes are found in the seafloor surrounding Australia.
“The old map suggests much of the Southern Ocean around Australia is mainly covered by clay blown off the continent, whereas our map shows this area is actually a complex patchwork of microfossil remains,” said Adriana Dutkiewicz. “Life in the Southern Ocean is much richer than previously thought.”