2014: Will It Be The Hottest Year Ever?
Last month was the warmest May in recorded history—and if El Nino gets its way in late 2014, this year could be the balmiest ever.
Last month was the warmest-ever May in the history of temperature records, leaving atmospheric scientists to wonder: Will 2014 go down as the hottest year ever?
“For 351 months in a row, or more than 29 years, global temperatures have been warmer than average,” writes Andrea Thompson at Climate Central. “May 2014 was the 351st month in that uninterrupted series.”
The potential spoiler is the cyclical El Nino event: a band of unusually warm ocean water that periodically forms along the equatorial Pacific Ocean and drives up global temperatures. We’re definitely in an El Nino year, according to National Oceanic and Atmospheric Administration (NOAA), but the phenomenon may not peak until the Northern winter, which would push most of its effects into 2015, and likely put next year into contention for the hottest ever since record-keeping began in 1880.
- The average temperature over land and ocean combined in May 2014 was 1.33 degrees Fahrenheit (0.74 degrees Celsius) higher than the 20th century average of 58.6°F (14.8°C)
- Taken separately, temperatures over land were the fourth highest on record.
- Temperatures over ocean in May were the highest on record, and tied with three other records (all set within the past two decades) for “the highest departure from average for any month on record.”
- Alaska had its sixth warmest May since record-keeping for that region began in 1918: 3.56°F (1.98°C) above the 1971–2000 average.
Another indicator of intensifying global warming: The area of Arctic Ocean covered by sea ice, a major influencer of weather for the Northern Hemisphere, continued its multi-year shrinking trend.
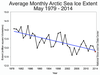
Arctic Sea Ice Downward Trend
“Arctic sea ice extent for May averaged 12.78 million square kilometers (4.93 million square miles),” the National Snow and Ice Data Center (NSIDC) reported June 3. “This is 610,000 square kilometers (235,500 square miles) below the 1981 to 2010 average for the month. May 2014 is now the third lowest May extent in the satellite record.”
As we recently reported, the multi-year warming trends in the far north, collectively called the “Great Arctic Melt,” are already transforming the region. Scientists are trying to figure out what those changes mean for both the Arctic and the entire planet–climatically, ecologically, and politically.
Teasing apart the impacts of human-propelled climate changes from those caused by natural cycles can still be difficult. Researchers are still hunting for plausible reasons why the area of Antarctic sea ice for May was an above-average 4.64 million square miles (12.03 million square kilometers), according to the NSIDC, despite the multi-year overall increase in global surface temperatures. “This is 1.24 million square kilometers (478,800 square miles) above the 1981 to 2010 average for the month,” the agency reports, and the highest May ice extent in satellite record-keeping.